KEY INSIGHTS
The BTC/USD pair is showing mixed trends across timeframes, with short-term uptrends.
Key support and resistance levels to monitor are $92,654.5 and $99,554.3.
MACD signals a bullish crossover, indicating potential upward momentum.
Introduction
Focus and Review of the Previous Article
Last week, BTC/USD exhibited a consolidation phase, remaining range-bound between major support and resistance levels. The neutral daily trend persisted as price hovered near critical moving averages.
Market Changes Since Last Week
The pair has shown slight bullish momentum in lower timeframes, marked by a golden cross on the 1-hour chart. Price remains above critical moving averages, signaling near-term buying interest.
Detailed Analysis
Daily Chart: Key Price Levels
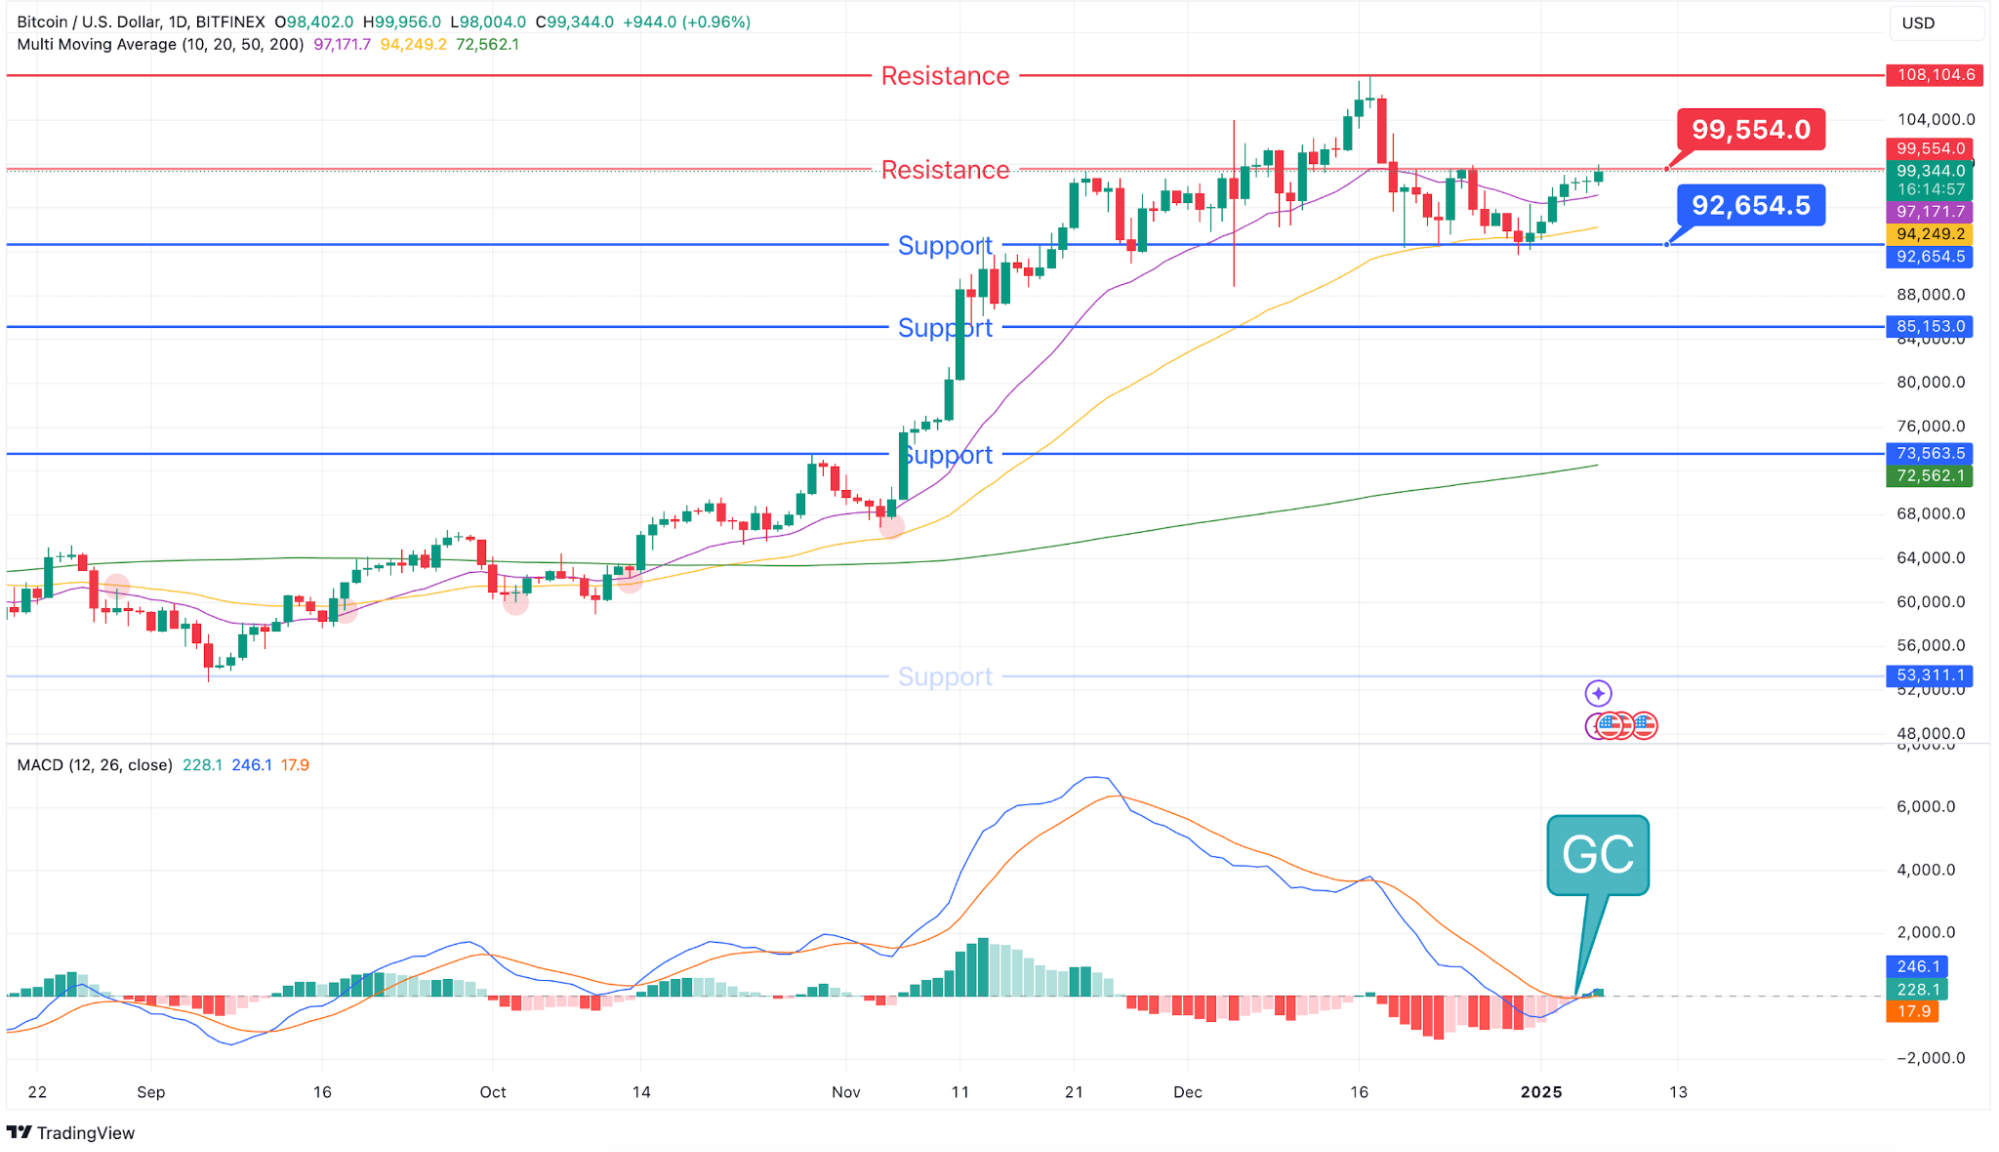
- Trend: Neutral
- Support Level: $92,654.5
- Resistance Level: $99,554.3
- MACD: Golden cross observed, histogram positive but near zero.
- Moving Averages: Price is above both the 50MA ($94,249.2) and 200MA ($72,562).
Key Takeaway
The daily chart reflects a consolidation phase. With price maintaining above critical moving averages and a golden cross in MACD, a potential upward breakout could occur if resistance at $99,554.3 is tested and surpassed.
4-Hour Chart: Key Price Levels
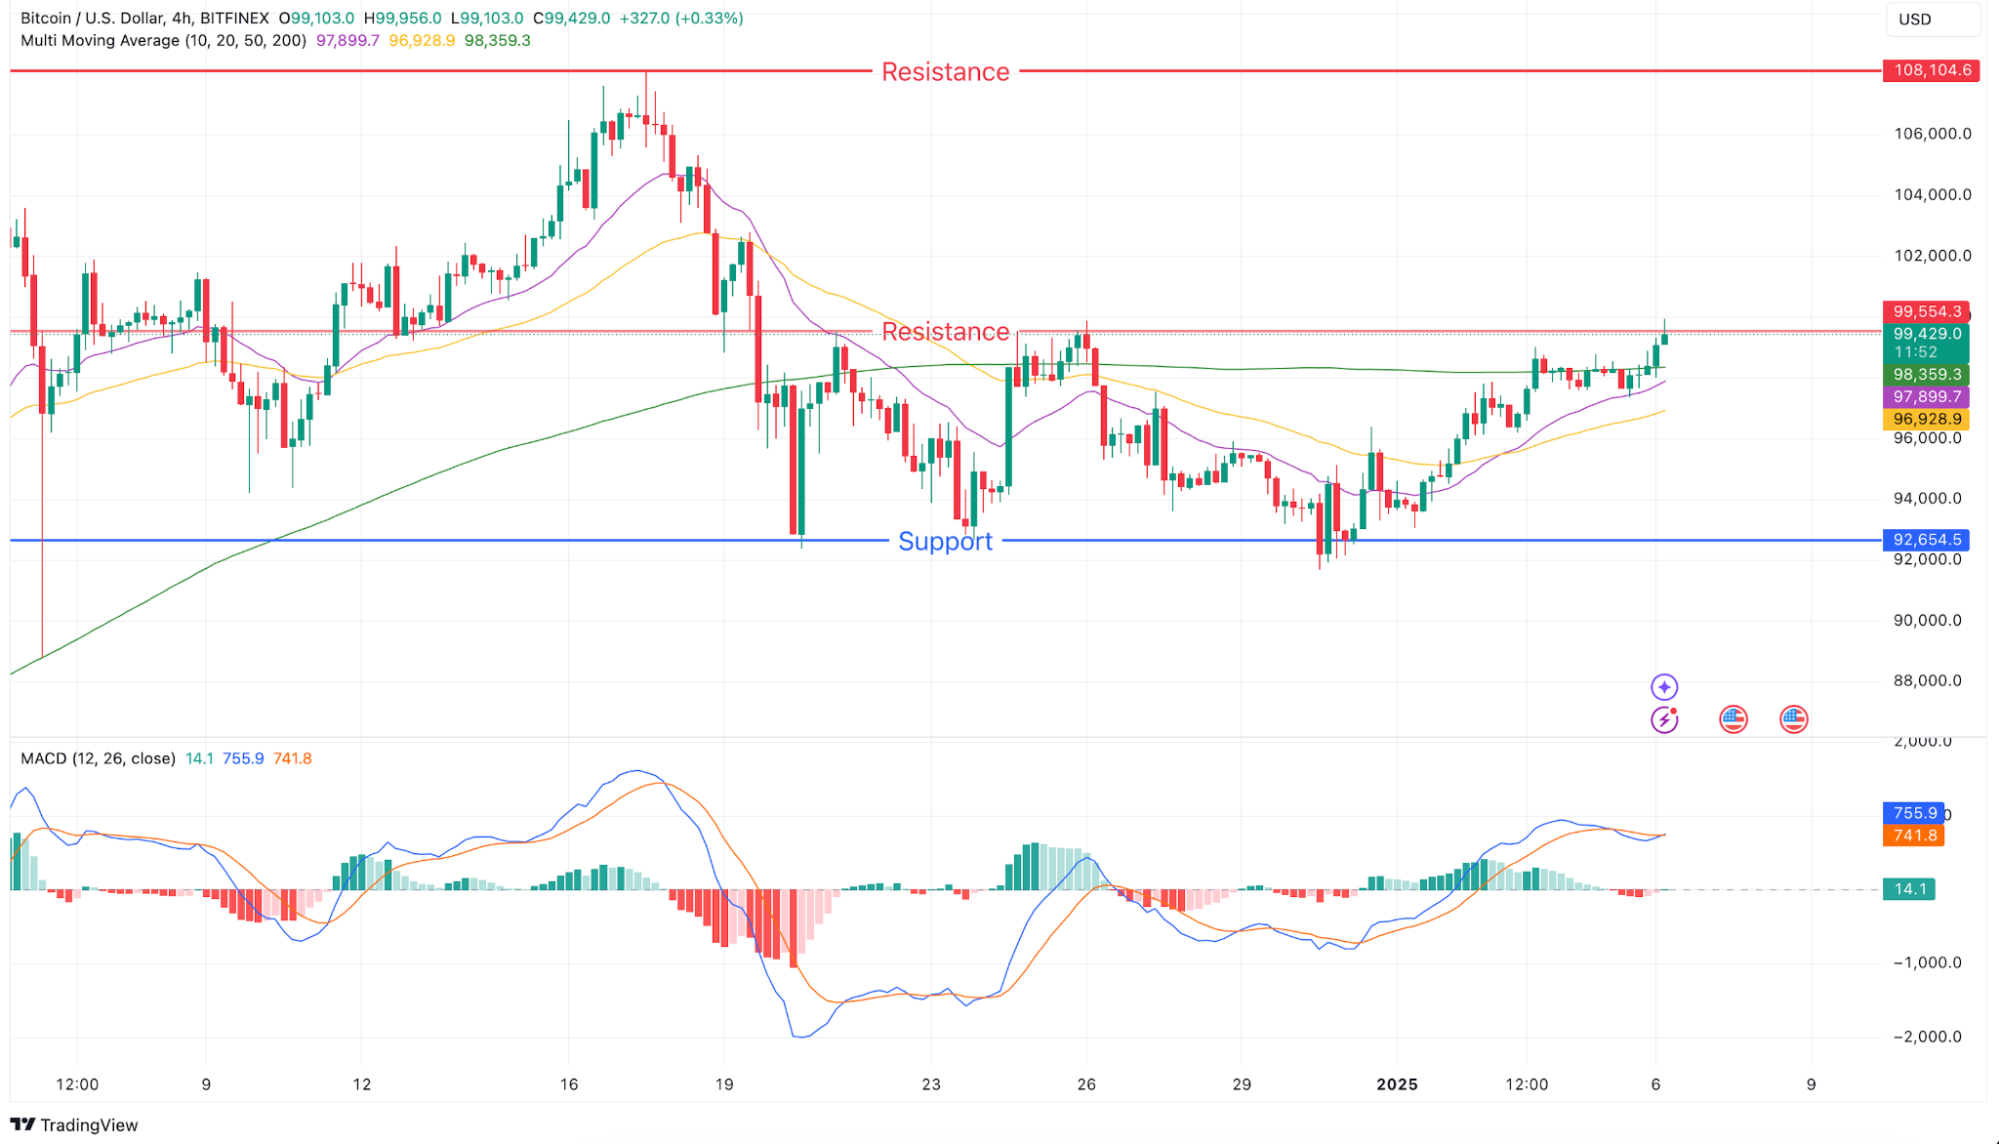
- Trend: Neutral
- Support Level: $92,654.5
- Resistance Level: $99,554.3
- MACD: Uptrend with a positive histogram; lines are near zero.
- Moving Averages: Price above both 50MA ($96,928.9) and 200MA ($98,359.3).
Key Takeaway
The 4-hour timeframe reveals bullish undertones with price sustaining above key moving averages. While the MACD histogram shows an uptrend, the proximity of lines to zero suggests limited momentum for now.
1-Hour Chart: Key Price Levels
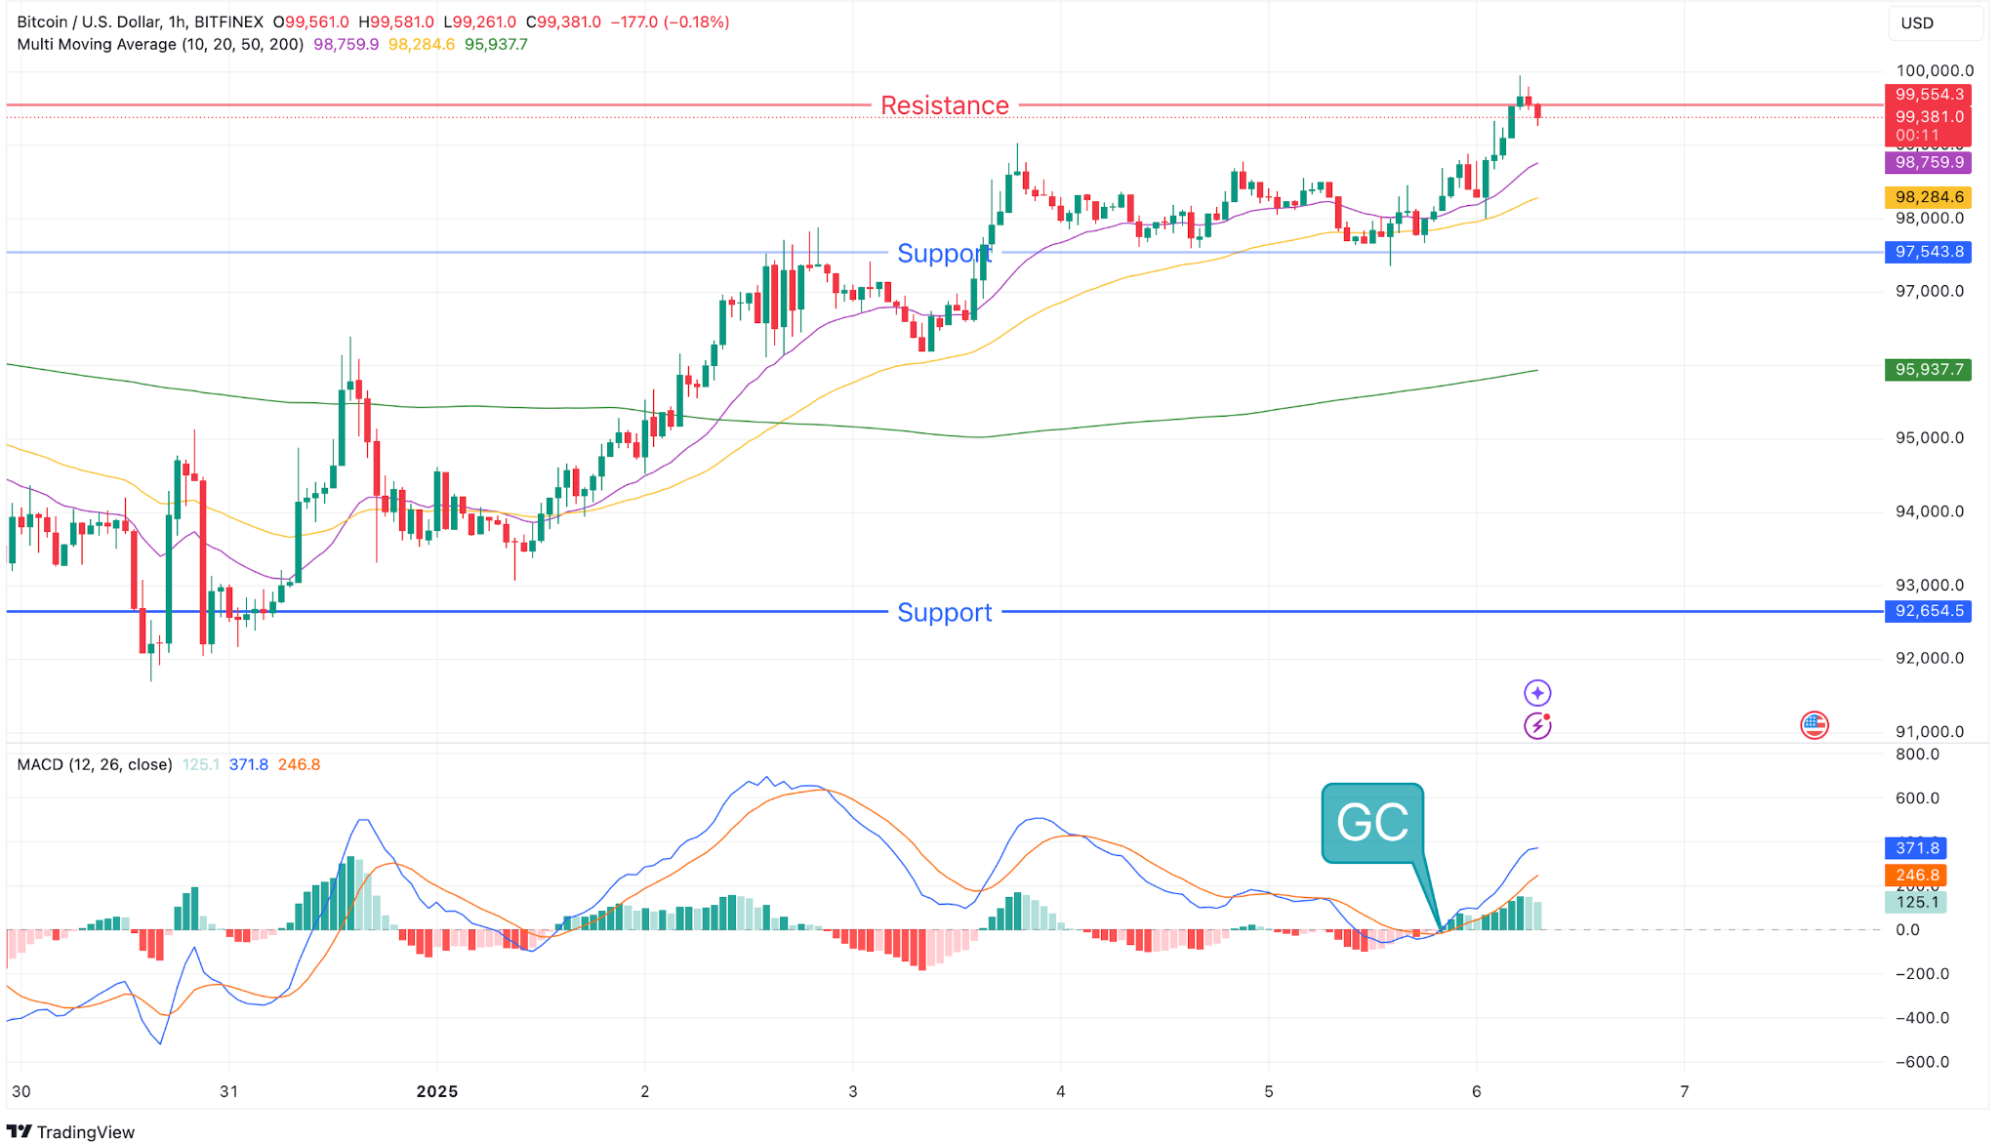
- Trend: Uptrend
- Support Levels: $92,654.5 and $97,543.8
- Resistance Level: $99,554.3
- MACD: Golden cross observed with a positive histogram and divergence of 126.2.
- Moving Averages: Price above both 50MA ($98,284.6) and 200MA ($95,937.78).
Key Takeaway
The 1-hour chart reflects a strong short-term uptrend. The golden cross and higher MACD divergence suggest sustained buying interest, but resistance near $99,554.3 may pose a challenge.
Conclusion
The BTC/USD pair presents mixed trends across timeframes. While the daily trend remains neutral, shorter timeframes indicate upward momentum, supported by golden crosses and positive MACD signals. Critical support and resistance levels at $92,654.5 and $99,554.3 should be closely monitored for potential breakout scenarios. A move above resistance could reinforce bullish sentiment.
Beginner Friendly Glossary
- Golden Cross: A bullish signal where the short-term moving average crosses above the long-term moving average.
- MACD: A momentum indicator showing the relationship between two moving averages of an asset’s price.
- Resistance Level: The price point at which an asset faces selling pressure.
- Support Level: The price point where an asset tends to find buying interest.
- Trend: General direction in which the market moves.
- Moving Average (MA): A calculation to analyze price data over a specified period.
- Histogram: A graphical representation of MACD divergence.
- Uptrend: A market condition characterized by higher highs and higher lows.
- Divergence: A situation where price and an indicator move in opposite directions.
- EMA (Exponential Moving Average): A type of moving average that gives more weight to recent prices.
DISCLAIMER: THE CONTENT PROVIDED IN THIS ARTICLE IS FOR INFORMATIONAL PURPOSES ONLY AND SHOULD NOT BE CONSIDERED FINANCIAL, LEGAL, OR INVESTMENT ADVICE. CRYPTOCURRENCY INVESTMENTS CARRY A HIGH DEGREE OF RISK AND MAY NOT BE SUITABLE FOR EVERY INVESTOR. PAST PERFORMANCE DOES NOT GUARANTEE FUTURE RESULTS. THIS ANALYSIS IS INTENDED PURELY AS AN OBSERVATION OF SPECIFIC PRICE LEVELS AND TRENDS TO AID IN UNDERSTANDING POTENTIAL MARKET DIRECTIONS. YOU ARE ENCOURAGED TO DO YOUR OWN RESEARCH AND CONSULT WITH A LICENSED PROFESSIONAL BEFORE MAKING ANY FINANCIAL DECISIONS. THE INFORMATION HEREIN IS CURRENT AS OF THE PUBLICATION DATE AND MAY CHANGE WITHOUT NOTICE.