KEY INSIGHTS
- Confirmation of resistance at $99,554 and $102,802.9: These levels have functioned as resistance zones, and a downward trend was observed after prices failed to break through.
- Support role of the 50-day moving average on the daily chart: The 50-day moving average continues to act as a support line in the current price movements.
- Potential double bottom formation near $92,654.5: If this price level holds as support, there are indications that a range-bound market may develop.
Introduction
Focus and Review of the Previous Article
The previous analysis highlighted a post-peak adjustment phase in the Bitcoin market, with particular attention on the resistance levels at $99,554 and $102,802.9. These levels were confirmed as resistance, and a price downturn followed.
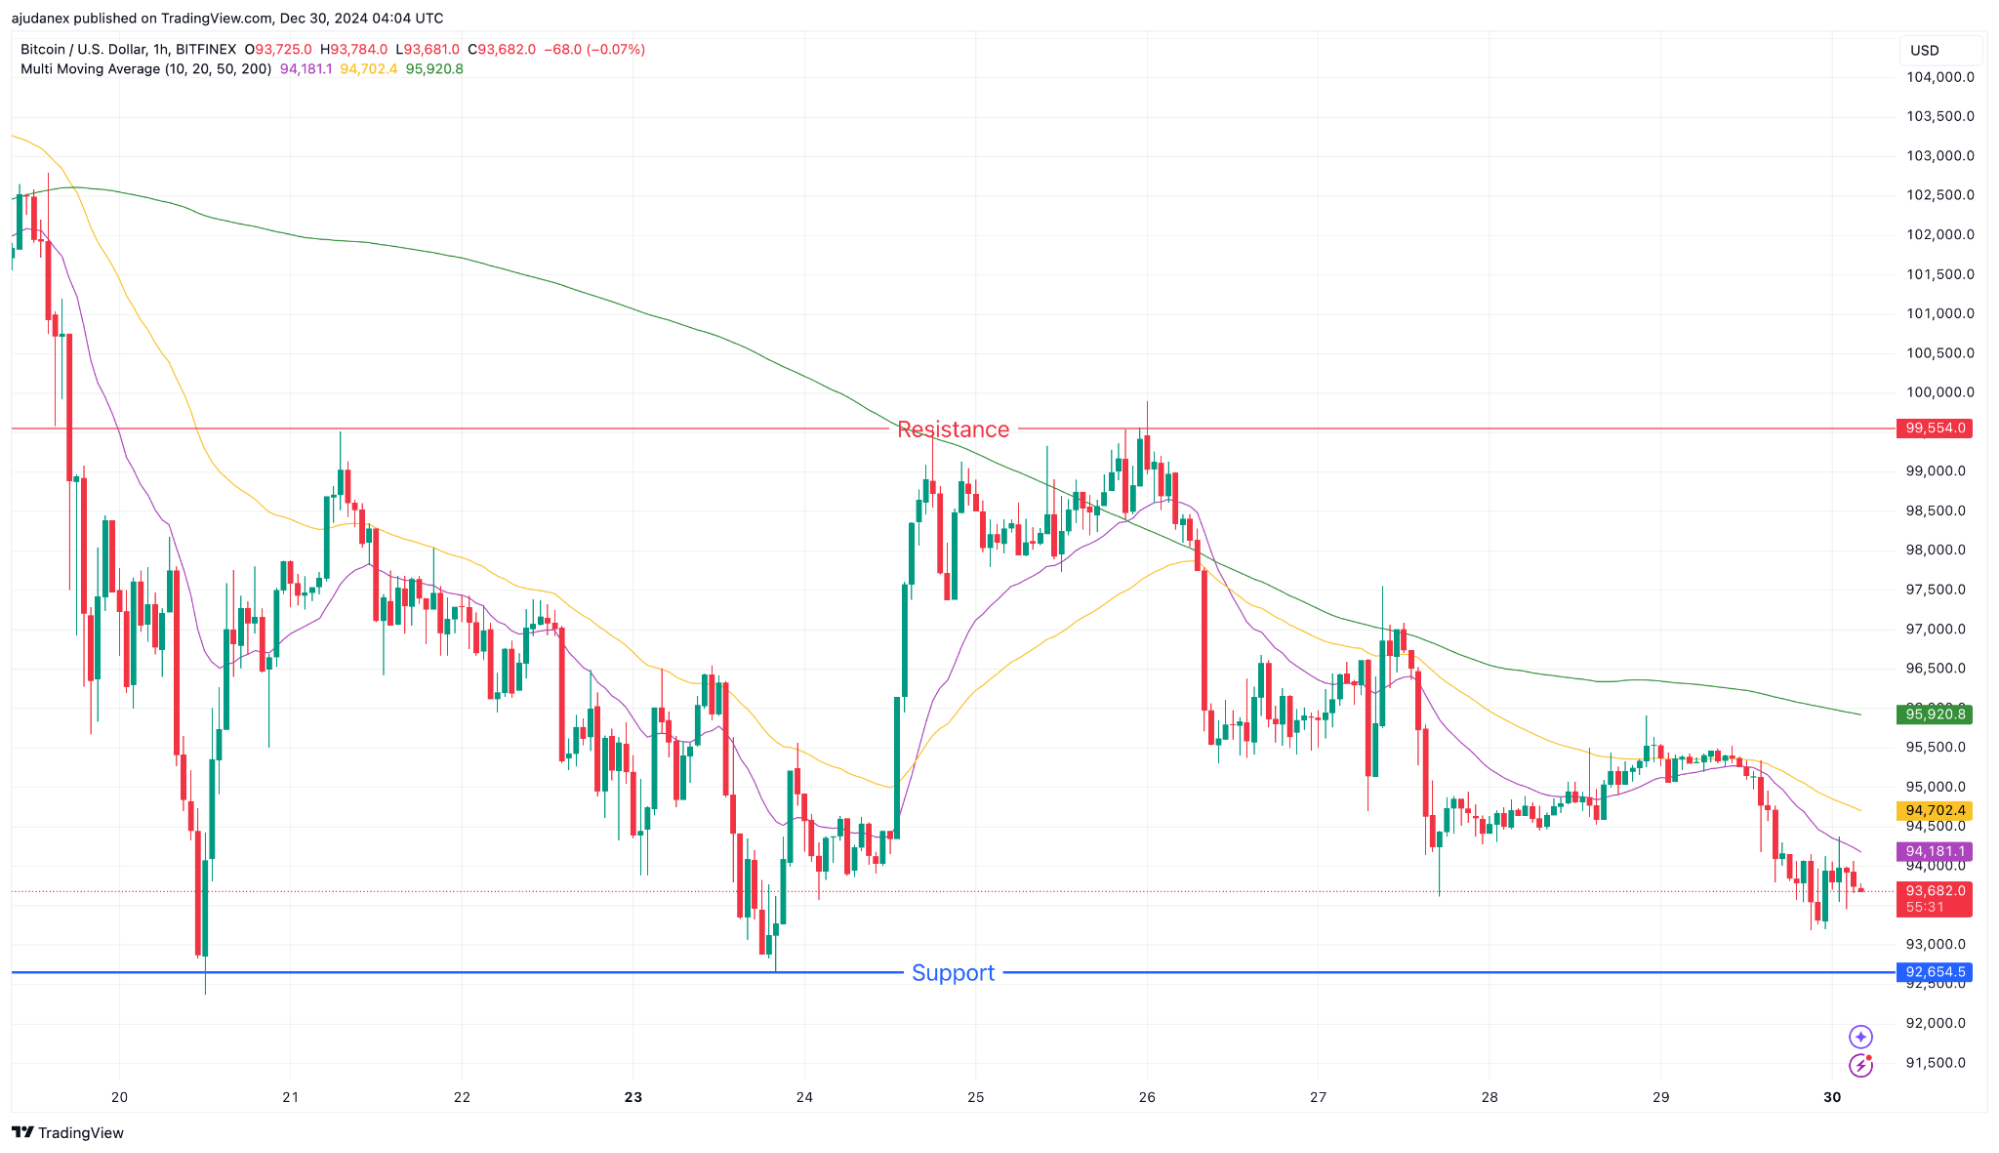
Price Review & Summary of Last Week’s Analysis
On December 24 and 26, the $99,554 level was tested, but after briefly breaking above, the price closed with upper wicks, demonstrating the strength of this resistance level. Although the 50-day moving average currently supports the price, a break below could shift focus to support levels at $92,654.5, $85,153.0, and $73,563.5.
Market Analysis & Price Action
Bitcoin failed to surpass the resistance levels at $99,554 and $102,802.9, seemingly transitioning into a downward trend. Currently, the 50-day moving average acts as support, while a support test near $92,654.5 is underway. In the short term, price action around this level may indicate the next market direction.
Detailed Analysis
Daily Chart: Key Price Levels
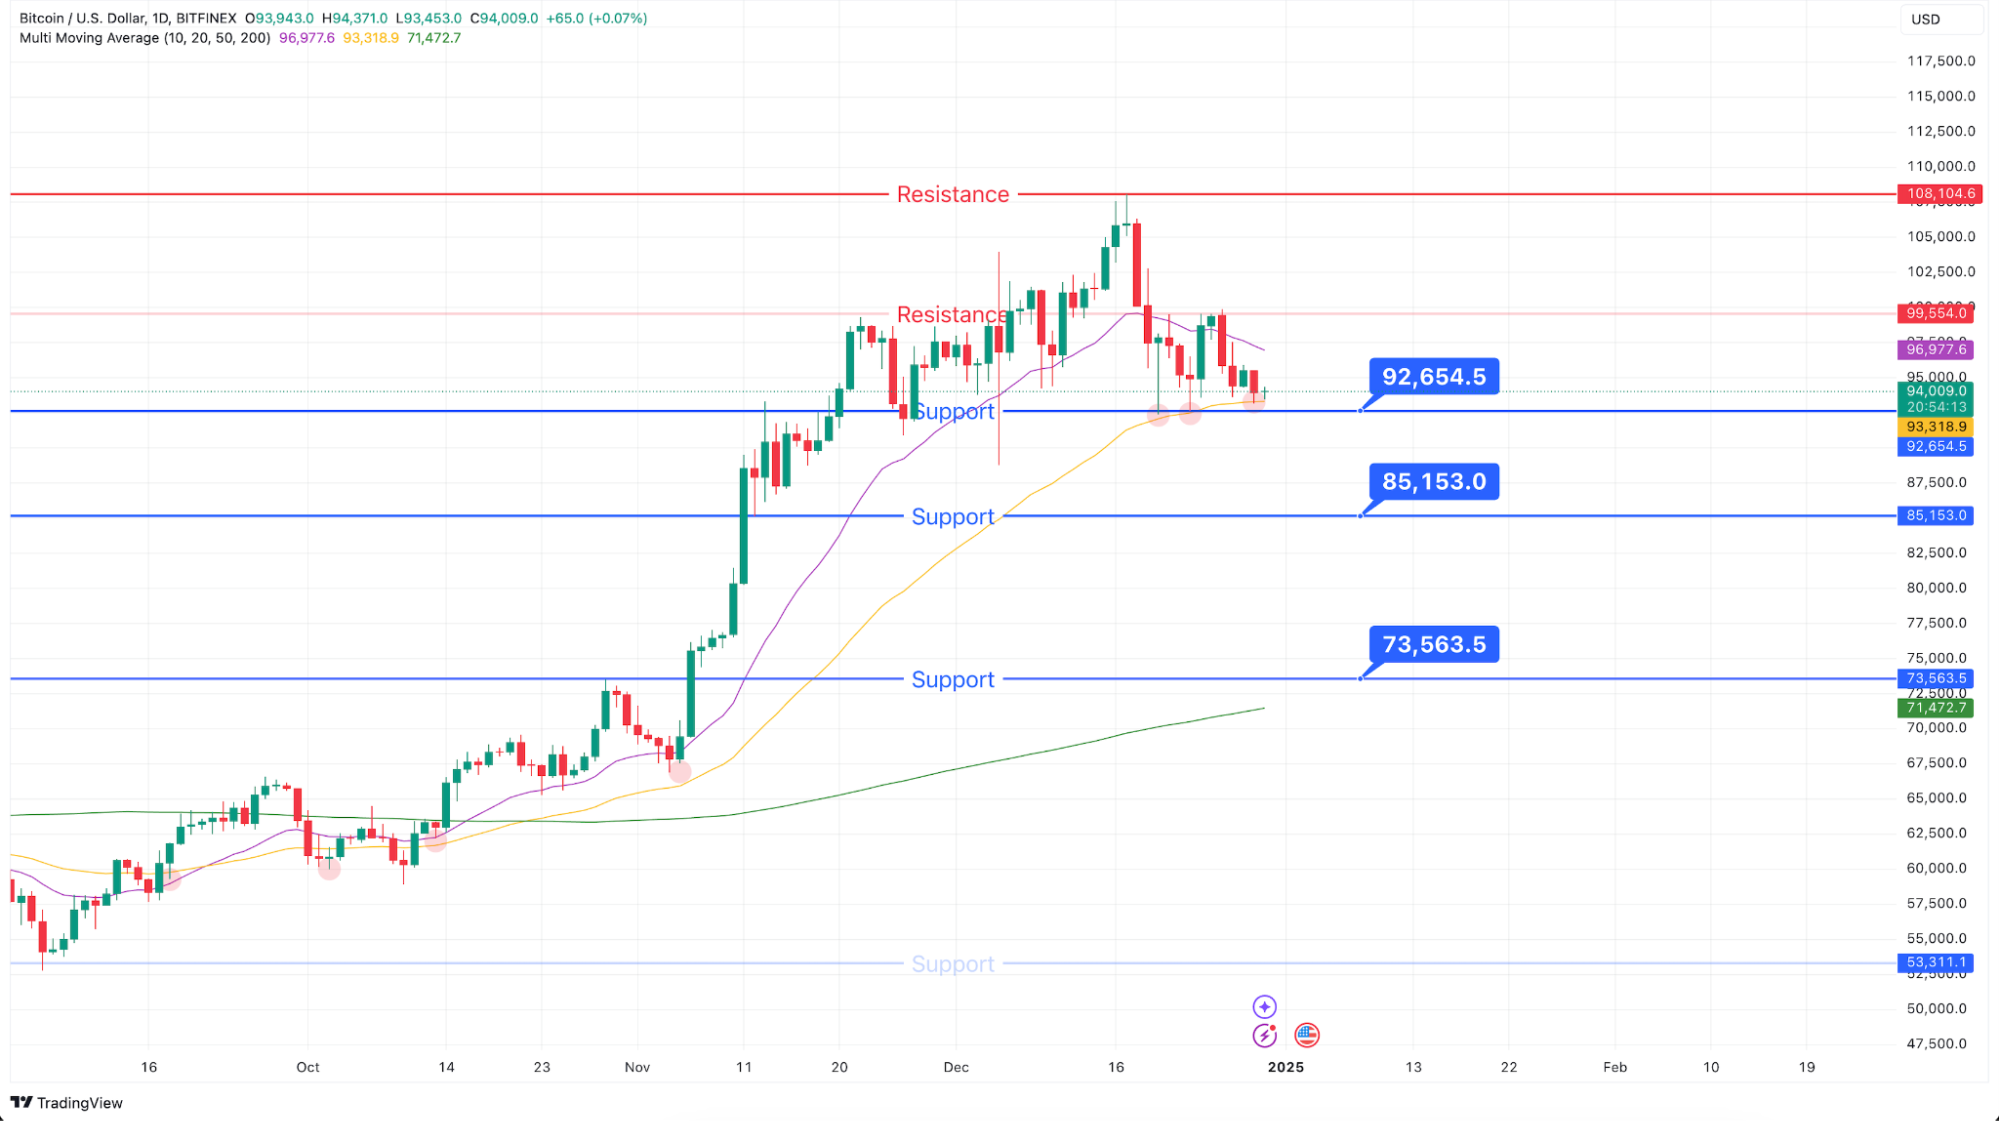
The 50-day moving average (approximately $93,200) appears to be functioning as a support line.
Should the 50-day moving average be breached, the following three support levels may become the next points of interest:
- $92,654.5
- $85,153.0
- $73,563.5
4-Hour Chart: Key Price Levels
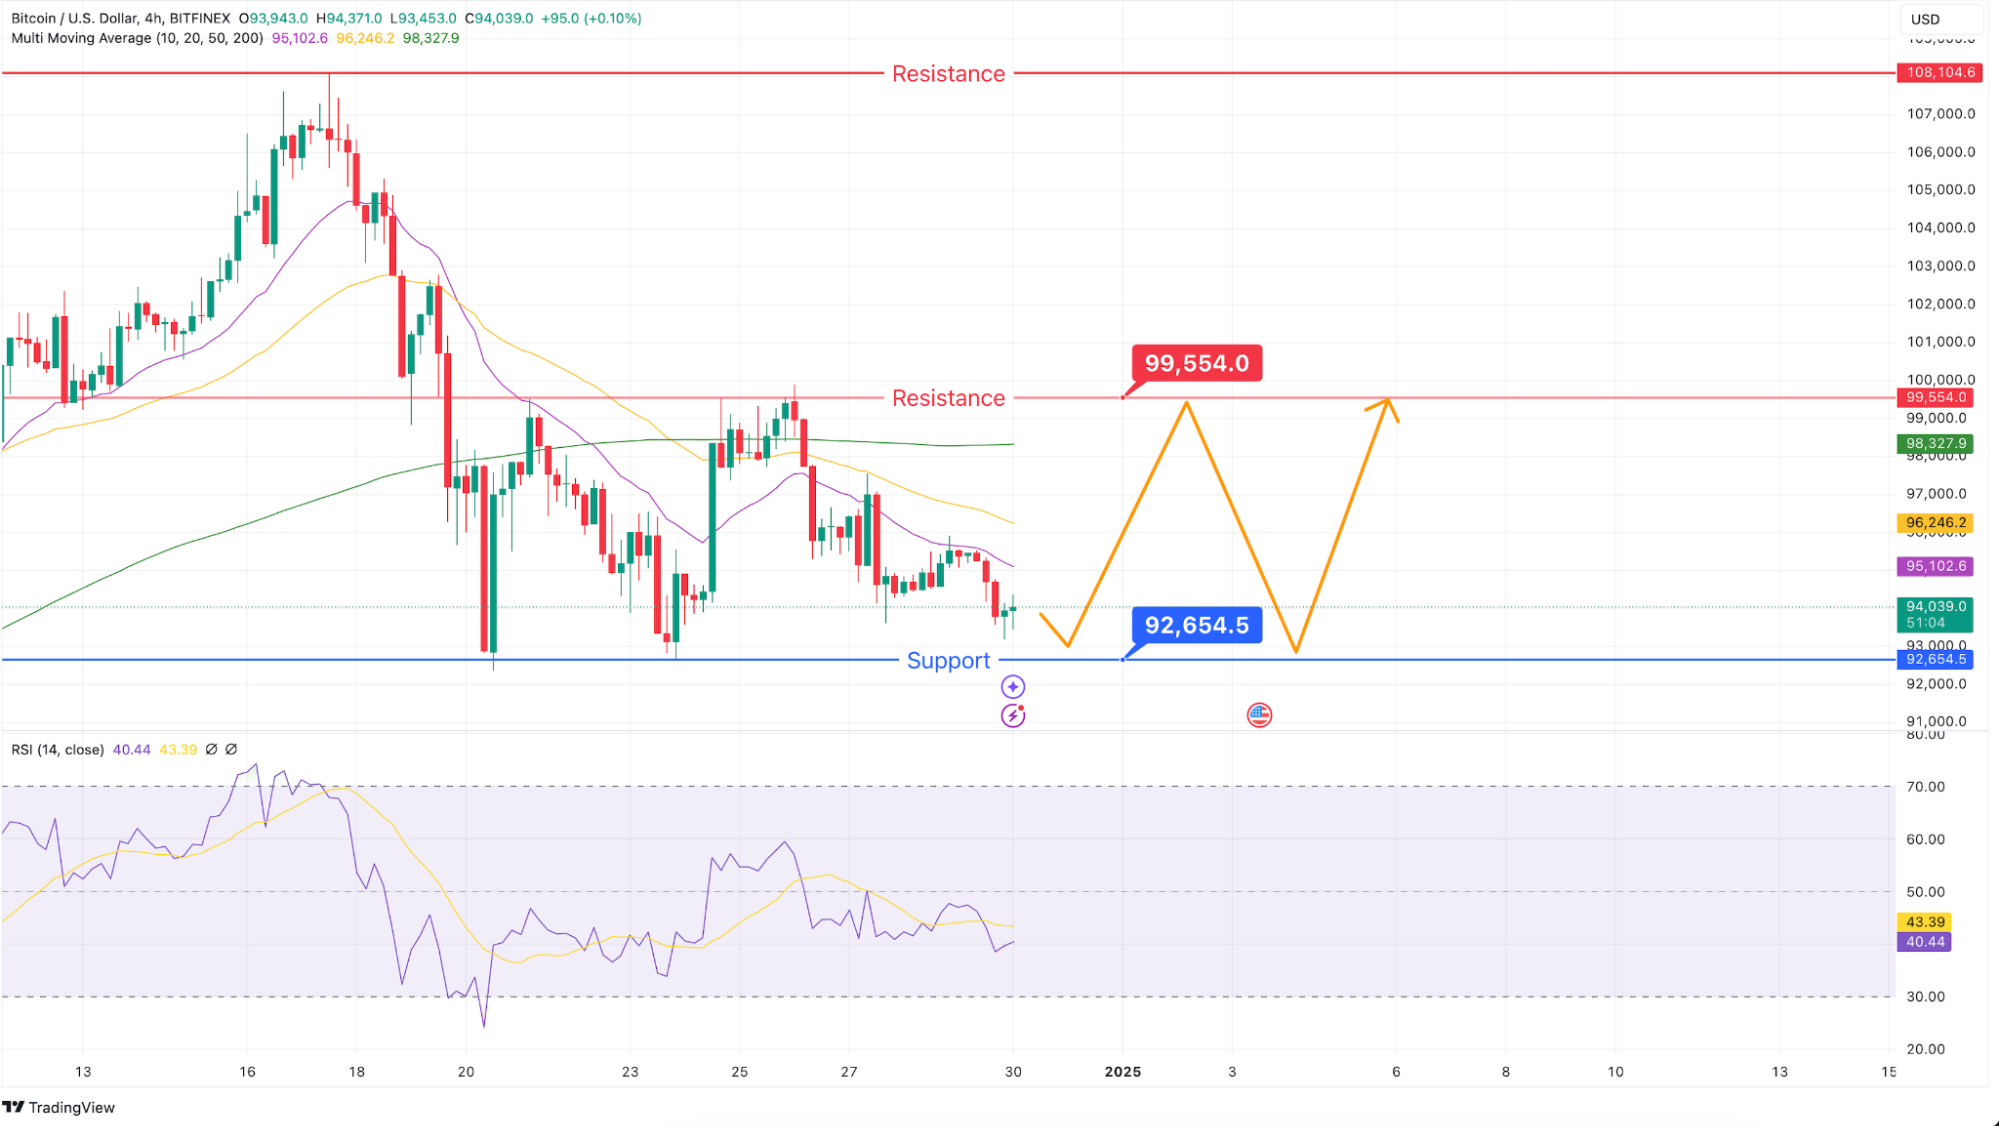
A double bottom formation is being tested near the recent low of $92,654.5.
If this level holds as support, there is a possibility of a range-bound market forming between $92,654.5 and $99,554.
Conclusion
The Bitcoin market continues to focus on the resistance levels of $99,554 and $102,802.9, which have acted as significant barriers, leading to a downward price movement. In the short term, attention is on the 50-day moving average as a key support level, with price action near $92,654.5 potentially determining the next trend.
Beginner Friendly Glossary
Bitcoin: A decentralized digital currency enabling peer-to-peer transactions without intermediaries, operating on a blockchain network.
Learn more here.Resistance Levels: Price points where an asset’s upward movement is hindered due to increased selling interest.
Learn more here.Support Levels: Price points where a downtrend is expected to pause due to a concentration of buying interest.
Learn more here.50-Day Moving Average: An average of an asset’s closing prices over the past 50 days, used to identify trends and potential support or resistance levels.
Learn more here.Double Bottom: A bullish reversal pattern indicating a shift from a downtrend to an uptrend, characterized by two distinct lows at approximately the same price level.
Learn more here.Range-Bound Market: A market condition where an asset’s price fluctuates within a specific range, bounded by support and resistance levels, without trending in a particular direction.
Learn more here.Upper Wick: The vertical line above a candlestick’s body on a price chart, representing the highest price reached during the trading period.
Learn more here.
DISCLAIMER: THE CONTENT PROVIDED IN THIS ARTICLE IS FOR INFORMATIONAL PURPOSES ONLY AND SHOULD NOT BE CONSIDERED FINANCIAL, LEGAL, OR INVESTMENT ADVICE. CRYPTOCURRENCY INVESTMENTS CARRY A HIGH DEGREE OF RISK AND MAY NOT BE SUITABLE FOR EVERY INVESTOR. PAST PERFORMANCE DOES NOT GUARANTEE FUTURE RESULTS. THIS ANALYSIS IS INTENDED PURELY AS AN OBSERVATION OF SPECIFIC PRICE LEVELS AND TRENDS TO AID IN UNDERSTANDING POTENTIAL MARKET DIRECTIONS. YOU ARE ENCOURAGED TO DO YOUR OWN RESEARCH AND CONSULT WITH A LICENSED PROFESSIONAL BEFORE MAKING ANY FINANCIAL DECISIONS. THE INFORMATION HEREIN IS CURRENT AS OF THE PUBLICATION DATE AND MAY CHANGE WITHOUT NOTICE.