KEY INSIGHTS
- BTC/USD is consolidating within a wide range between $91,677.6 (Support) and $108,104.6 (Resistance).
- Short-term trends (1H & 4H) remain bearish, with MACD Death Crosses and negative histograms.
- The long-term trend (Daily) is still bullish, with price remaining above the 200-day MA, but momentum is weakening.
Introduction
Review of the Previous Week:
BTC/USD tapped the upper boundary of the ascending channel before swiftly reversing downward, never making a run at the $108,000 resistance and instead holding a tight trading range. However, after Friday’s FOMC announcement, volatility erupted, triggering a sharp 10% plunge that ultimately drove prices down to the critical $91,677.6 support level.
Market Changes Since Last Week:
During last Friday’s FOMC meeting, Chairman Powell’s remarks on banks providing cryptocurrency-related services had a positive impact on market sentiment.
However, former President Donald Trump’s announcement of significant tariffs on Canada, Mexico, and China raised concerns that the Federal Reserve might respond with tighter monetary policy, including potential rate hikes. This intensified selling pressure, likely triggering the approximately 10% decline in BTC/USD.
Detailed Analysis
Weekly Chart: Key Price Levels
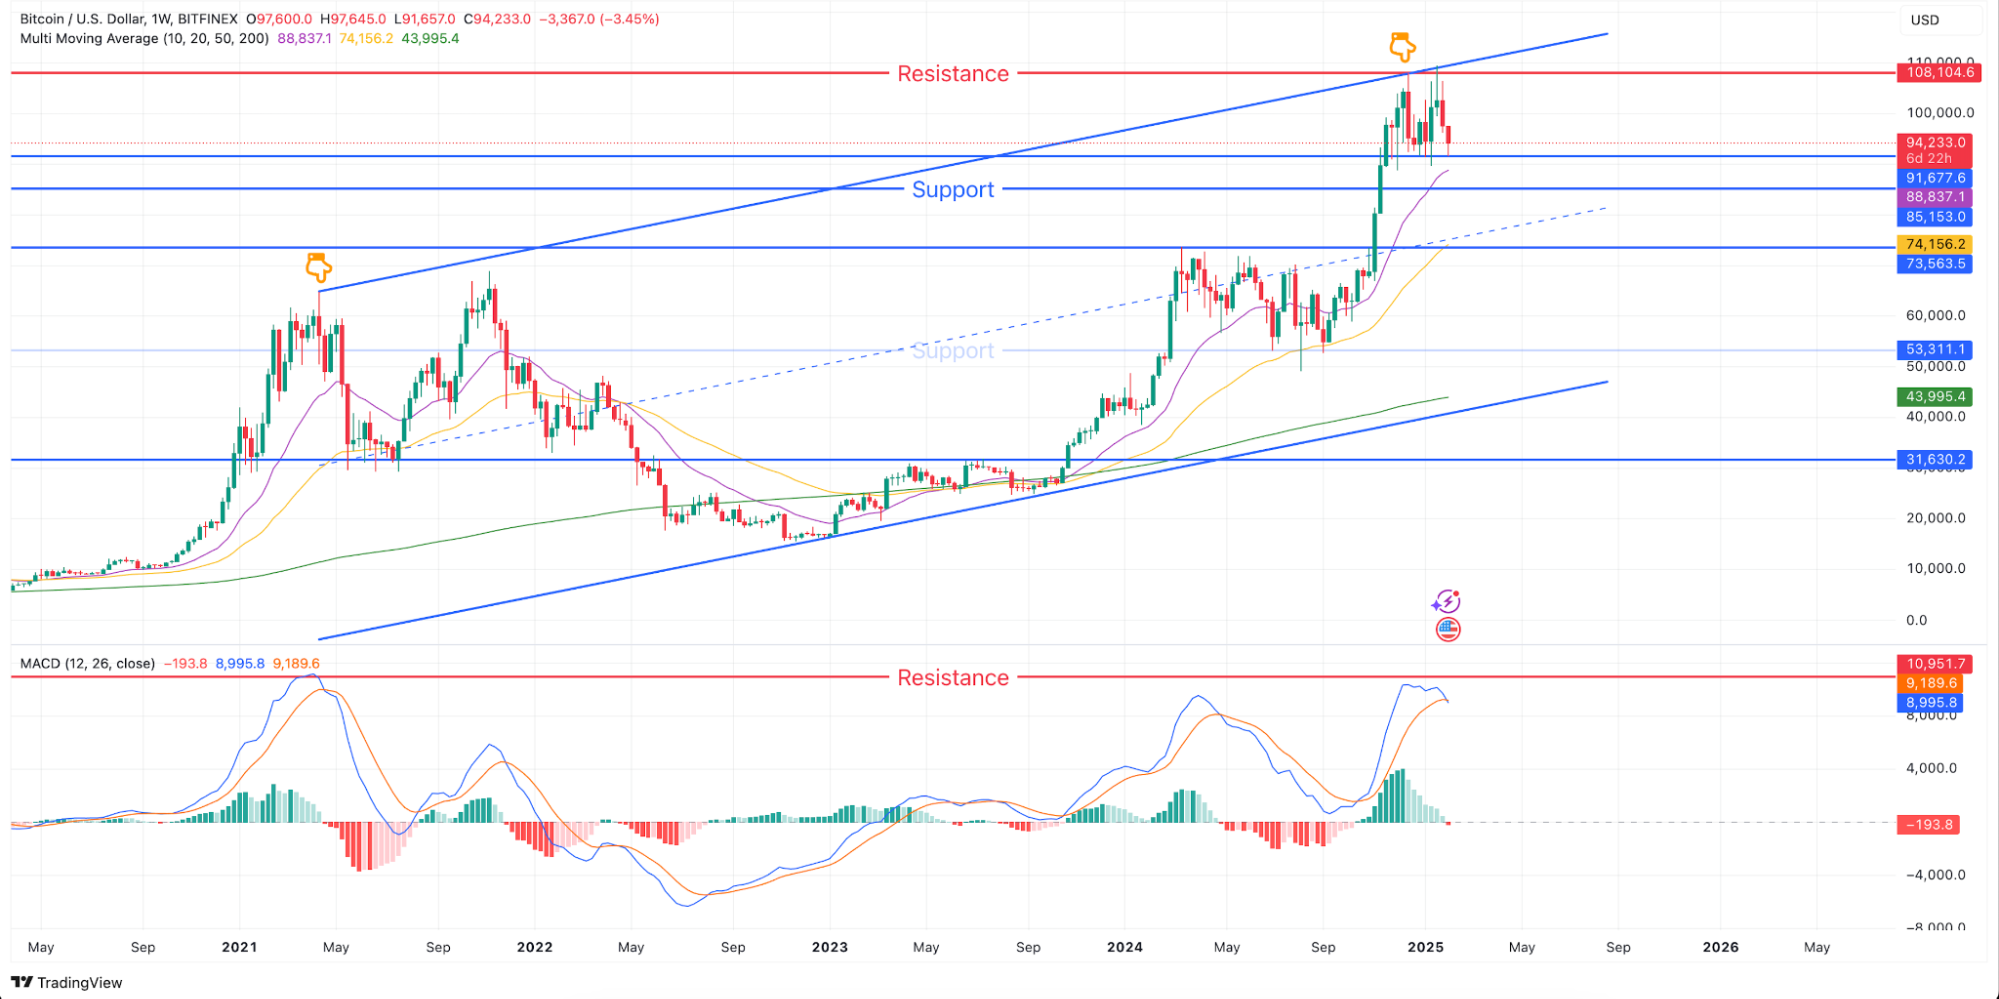
Summary
BTC/USD dropped straight to support at $91,677.6, reinforcing its significance alongside the ascending channel’s upper boundary. A breakout could ignite strong upside momentum, but MACD has already surpassed its previous high, signaling a tougher path for further gains. These key levels will define Bitcoin’s next major move.
Daily Chart: Key Price Levels
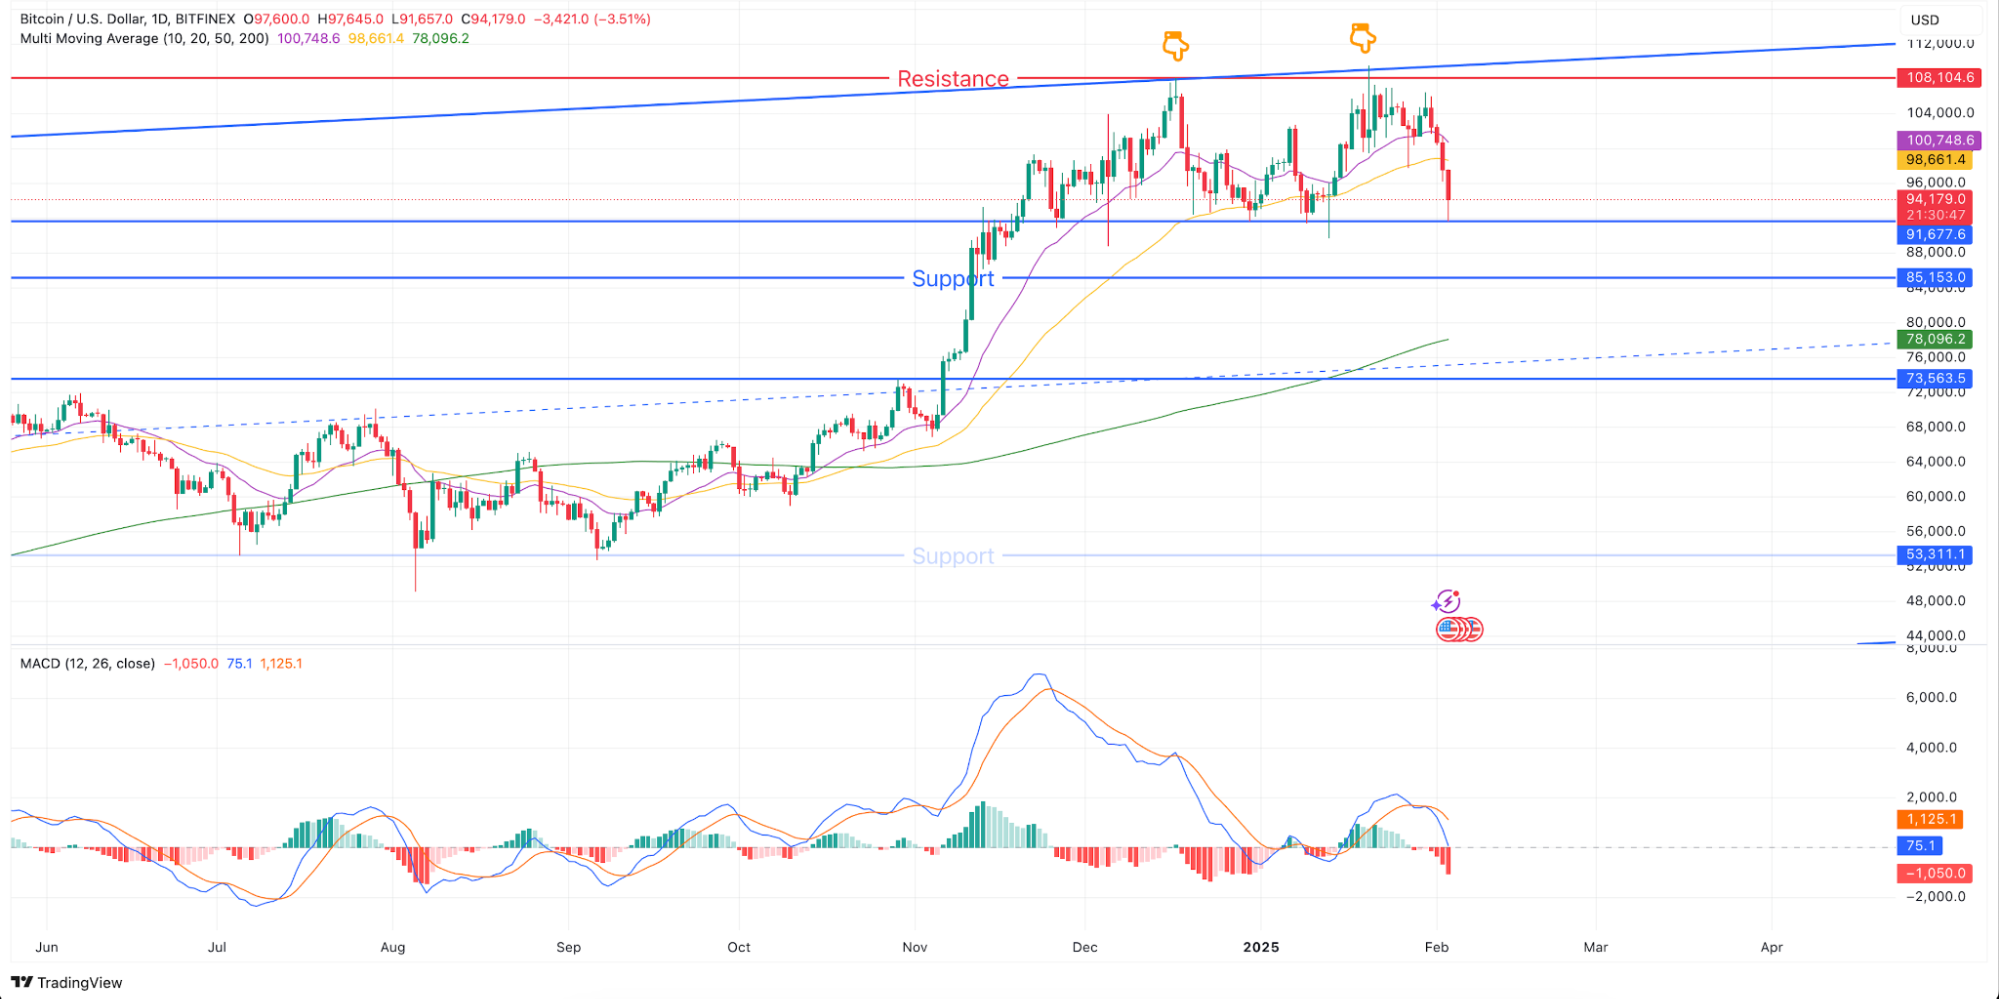
- Trend: Downward
- Support Level: $91,677.6
- Resistance Level: $108,104.6
- MACD Analysis: The MACD histogram is negative, and a Dead Cross has formed, signaling weakening bullish momentum. The MACD line remains below the signal line, reinforcing short-term bearish pressure.
- Moving Averages: The price is slightly above the 50-day MA ($98,661.4) but well above the 200-day MA ($78,096.2), maintaining a long-term bullish outlook despite short-term corrections.
Summary
The Daily trend is bearish, with MACD signaling caution. However, the long-term structure remains strong, and as long as $91,677.6 holds, a recovery remains possible. A break below this level, however, could trigger a move toward $73,563.5.
4-Hour Chart: Key Price Levels
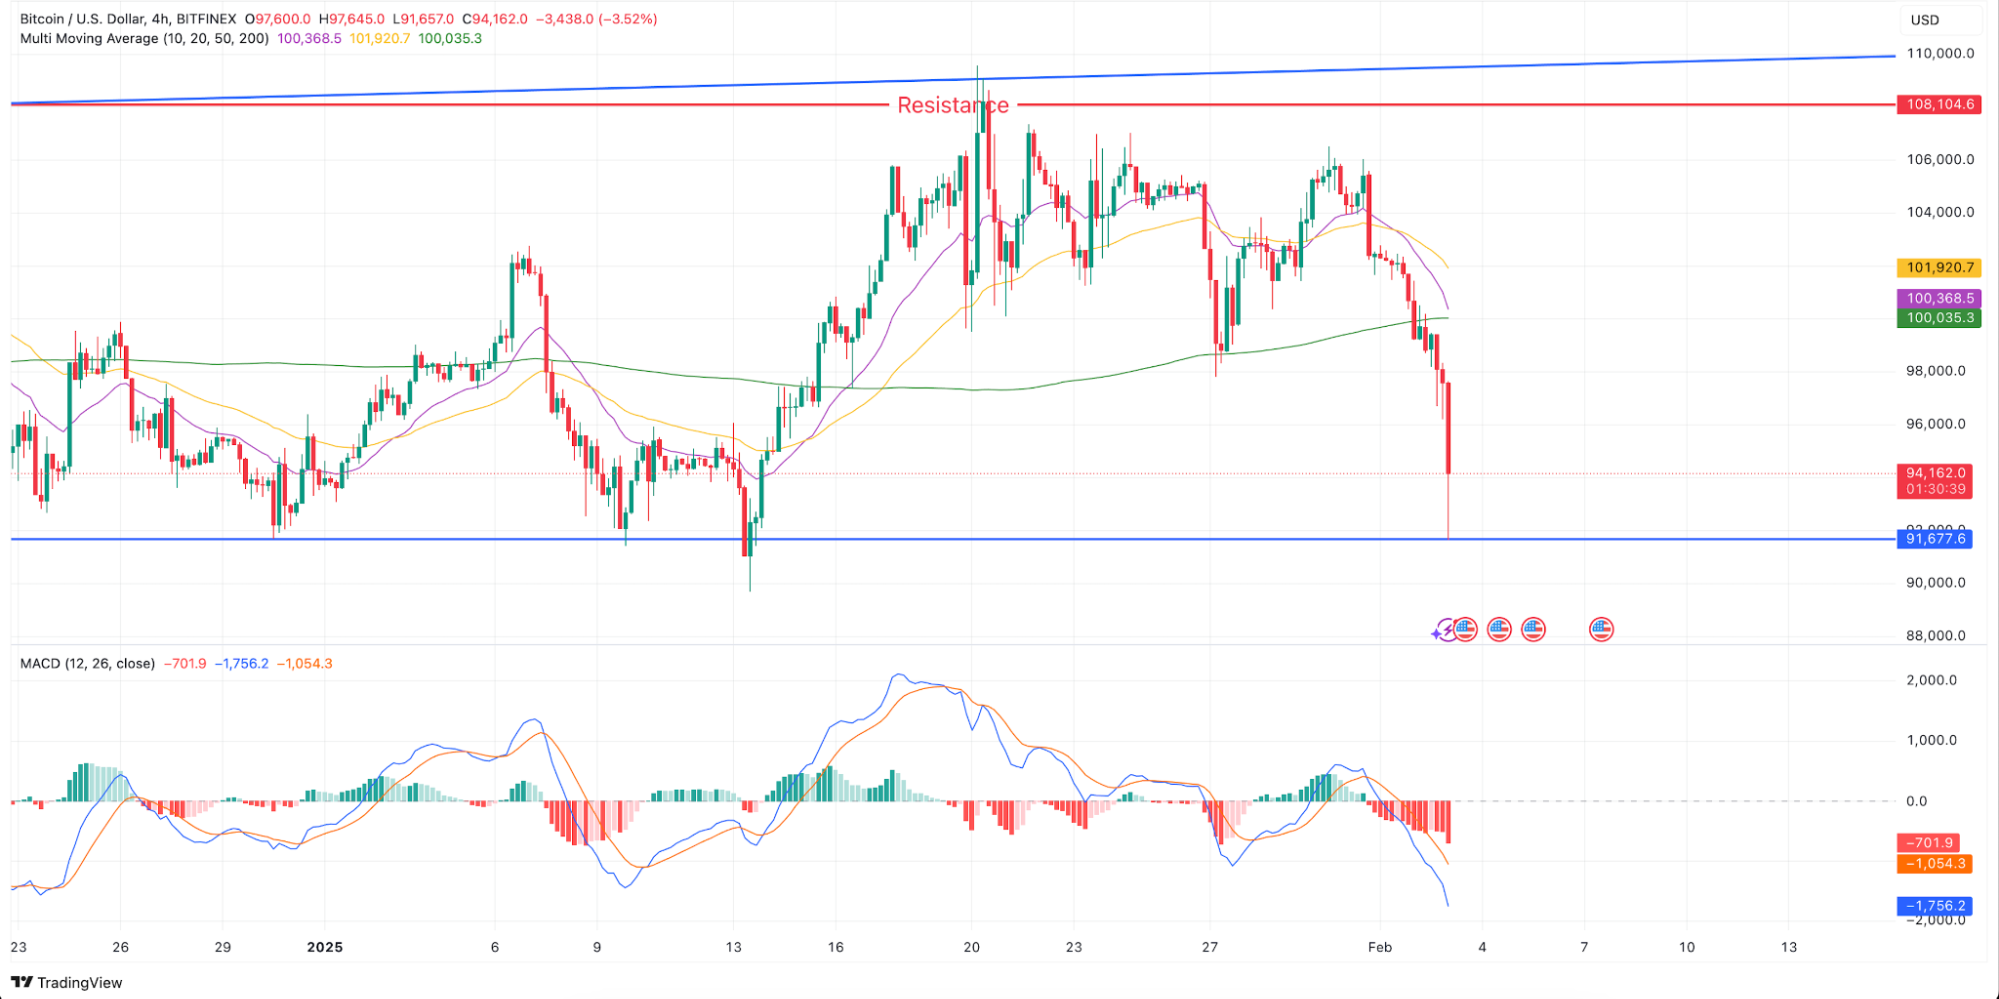
- Trend: Neutral
- Support Level: $91,677.6
- Resistance Level: $108,104.6
- MACD Analysis: The MACD histogram is negative, and a Dead Cross is in place, indicating weakening momentum. The MACD line is below the signal line, reinforcing bearish sentiment.
- Moving Averages: The price is above both the 50 MA ($101,920.7) and 200 MA ($100,035.3), suggesting longer-term bullish potential, but short-term indecision is evident.
Summary
The 4-hour trend remains neutral, but bearish MACD signals suggest potential downside pressure. A move below $91,677.6 could confirm a bearish shift, while holding this level might lead to consolidation before another attempt at resistance.
1-Hour Chart: Key Price Levels
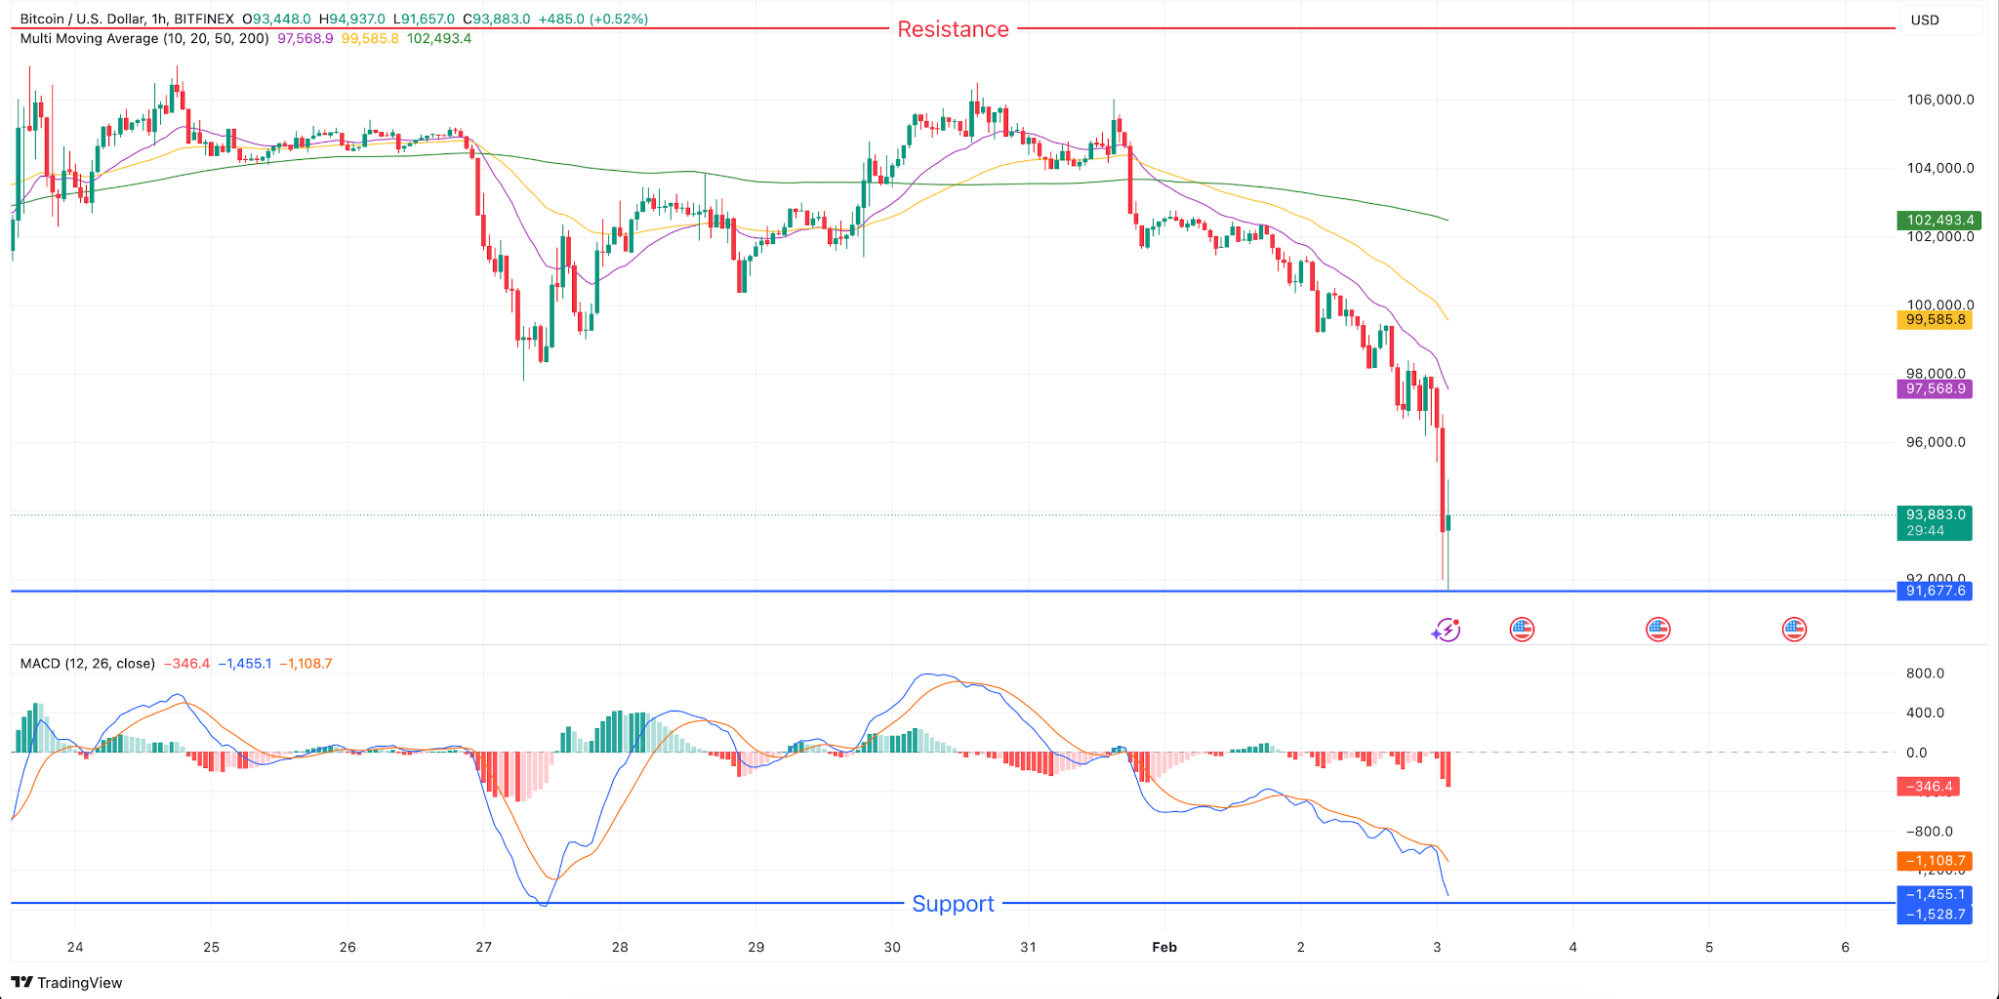
- Trend: Downward
- Support Level: $91,677.6
- Resistance Level: $108,104.6
- MACD Analysis: A Death Cross is present, and the MACD histogram remains negative, signaling continued short-term bearish pressure. Momentum remains weak, reinforcing the downside risk.
- Moving Averages: The price is below both the 50 MA ($99,585.8) and 200 MA ($102,493.4), confirming a short-term bearish trend. The increasing gap between these averages suggests strengthening bearish pressure.
Summary
The 1-hour trend remains bearish, with MACD and moving averages confirming downside risks. If $91,677.6 support breaks, further declines may follow. However, if this level holds, a short-term rebound toward resistance may occur.The 1-hour trend remains bearish, with MACD and moving averages confirming downside risks. If $91,677.6 support breaks, further declines may follow. However, if this level holds, a short-term rebound toward resistance may occur.
Conclusion
BTC/USD continues to trade within a defined range between $91,677.6 (Support) and $108,104.6 (Resistance), with short-term bearish momentum dominating the market.
- Short-term outlook (1H & 4H): Bearish, with price below key moving averages.
- Long-term outlook (Daily): Still bullish, but a potential test of $91,677.6 remains critical.
- Key Levels to Watch:
- Support: $91,677.6 (Breakdown could lead to $73,563.5).
- Resistance: $108,104.6 (Breakout could signal renewed bullish strength).
If bearish momentum persists, Bitcoin could see further declines, but maintaining support at $91,677.6 could lead to a recovery attempt toward $100,000+.
Beginner Friendly Glossary
Ascending Parallel Channel
A technical pattern where price fluctuates between two upward-sloping parallel trendlines, indicating a consistent bullish trend with clear support and resistance levels.
Learn more
Ascending Channel Resistance Line
The upper boundary of an ascending parallel channel, which acts as a dynamic resistance level where price action often faces selling pressure.
Learn more
MACD (Moving Average Convergence Divergence)
A momentum-based indicator that tracks the relationship between two moving averages to identify trend direction and potential reversals.
Learn more
FOMC (Federal Open Market Committee)
The branch of the Federal Reserve responsible for setting U.S. monetary policy, including interest rate decisions that significantly impact financial markets, including cryptocurrencies.
Learn more
Interest Rate Cut
A decision by a central bank to reduce its main interest rate, typically to lower borrowing costs and stimulate economic activity.
Learn more
Interest Rate Hike
An increase in the central bank’s main interest rate, aimed at raising borrowing costs to slow down economic activity and control inflation.
Learn more
DISCLAIMER: THE CONTENT PROVIDED IN THIS ARTICLE IS FOR INFORMATIONAL PURPOSES ONLY AND SHOULD NOT BE CONSIDERED FINANCIAL, LEGAL, OR INVESTMENT ADVICE. CRYPTOCURRENCY INVESTMENTS CARRY A HIGH DEGREE OF RISK AND MAY NOT BE SUITABLE FOR EVERY INVESTOR. PAST PERFORMANCE DOES NOT GUARANTEE FUTURE RESULTS. THIS ANALYSIS IS INTENDED PURELY AS AN OBSERVATION OF SPECIFIC PRICE LEVELS AND TRENDS TO AID IN UNDERSTANDING POTENTIAL MARKET DIRECTIONS. YOU ARE ENCOURAGED TO DO YOUR OWN RESEARCH AND CONSULT WITH A LICENSED PROFESSIONAL BEFORE MAKING ANY FINANCIAL DECISIONS. THE INFORMATION HEREIN IS CURRENT AS OF THE PUBLICATION DATE AND MAY CHANGE WITHOUT NOTICE.