KEY INSIGHTS
- Despite the Bybit hack, BTC remains stable. Institutional ETF inflows continue to support the market.
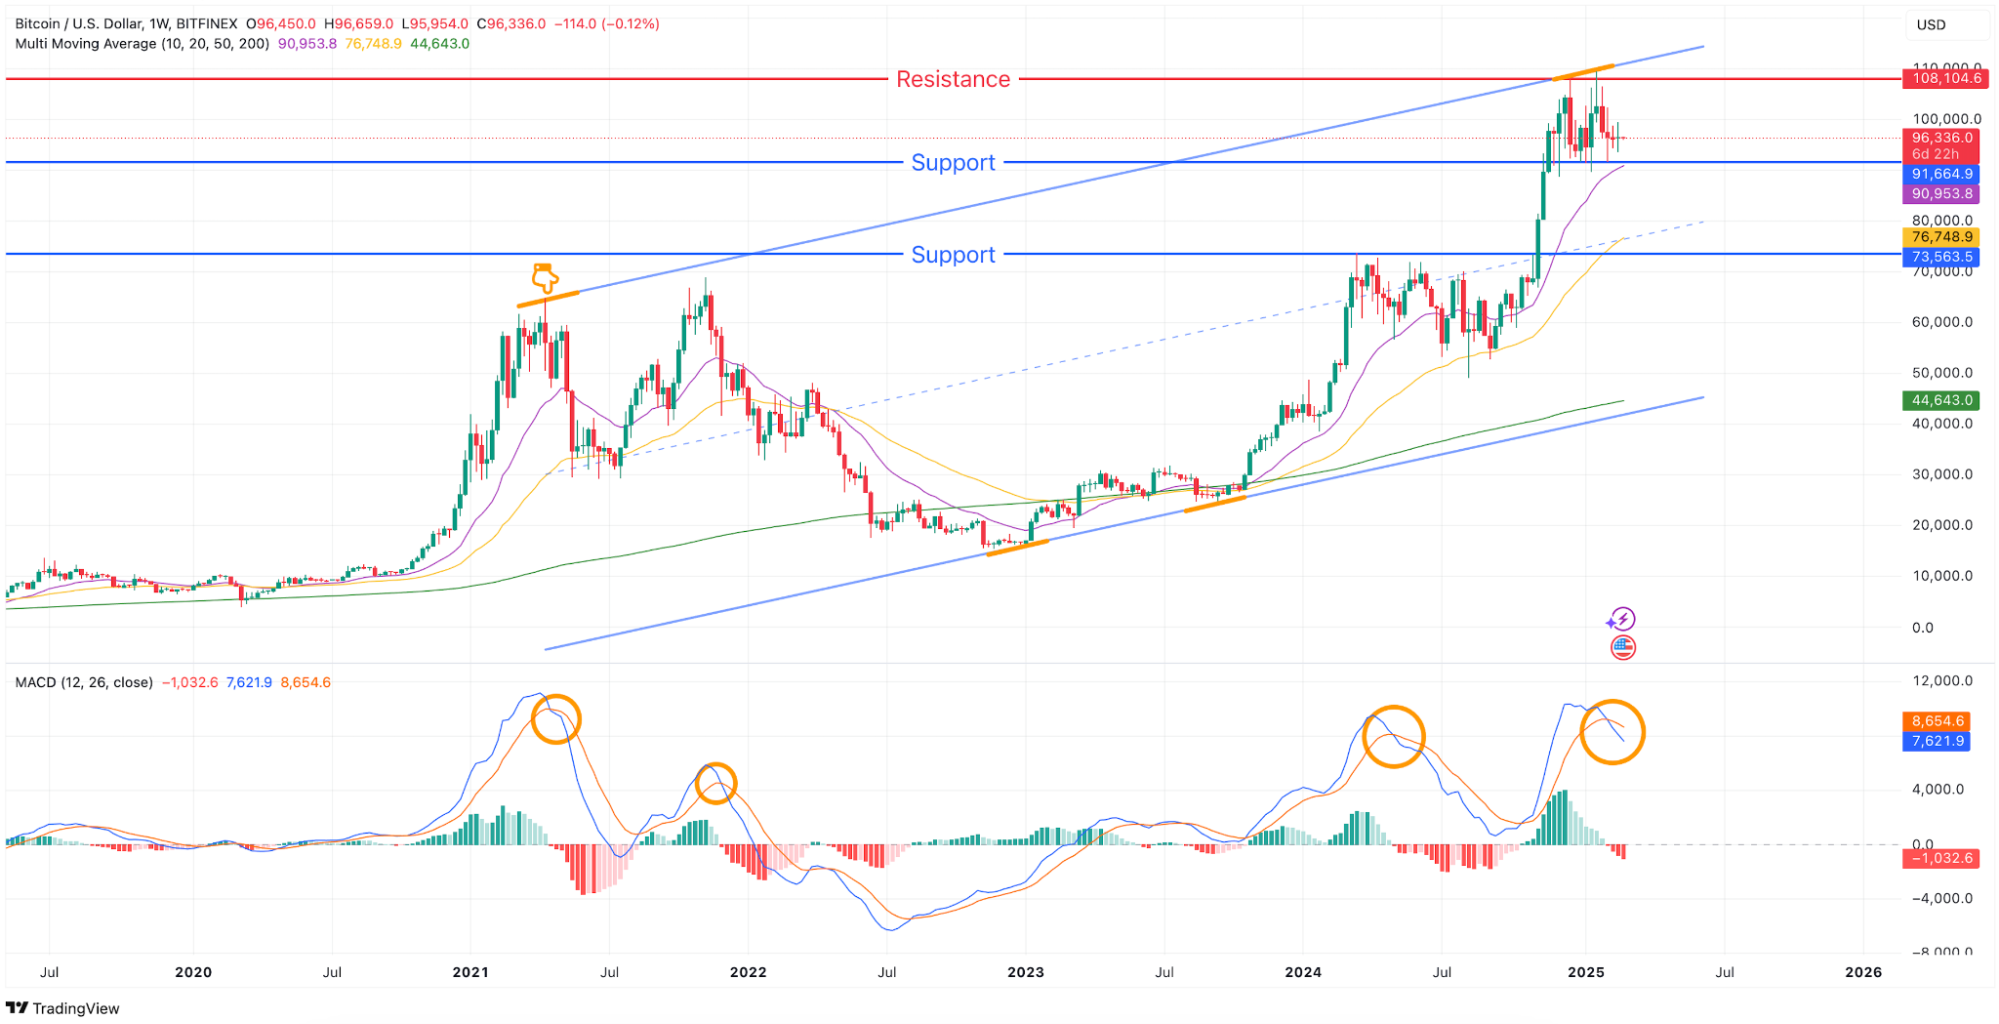
- The weekly MACD has formed a death cross, signaling a potential major trend shift. Historical patterns suggest the possibility of sharp price movements.
- BTC/USD maintains a neutral trend on both the daily and 4-hour charts, with price direction remaining unclear.
Introduction
Market Trends & Key Developments
Last week, the Bitcoin market resembled a massive ship navigating through a storm. The Bybit hack, institutional ETF accumulation, a 28,000 BTC whale purchase, and the Fed’s rate cut all collided—yet Bitcoin held its ground, pushing forward undeterred.
Typically, exchange hacks trigger intense selling pressure. However, this time was different. Despite the large-scale Bybit hack, BTC price remained stable. The reason? Continuous capital inflows into Bitcoin ETFs from institutional investors. Bitcoin is no longer just a “speculative asset”—it is becoming an integral part of the global financial system.
Another major highlight was the whale accumulation of 28,000 BTC. Transactions of this magnitude often send a strong bullish signal to the market. However, whale activity is never straightforward. Historically, large accumulations have often been followed by profit-taking sell-offs. Whether this marks the beginning of another rally or merely a temporary surge remains to be seen in the coming weeks.
Additionally, the Federal Reserve’s 25bp (0.25%) rate cut added another layer of uncertainty. Lower interest rates typically accelerate capital flows into risk assets, potentially benefiting Bitcoin. Some institutional investors have already started reallocating funds toward Bitcoin. However, caution is warranted—continued rate cuts could lead to a weaker dollar and rising inflation risks, increasing market volatility.
With these forces battling for dominance, Bitcoin stands firm, preparing for its next move. Will the market charge ahead into a bull run, or is a temporary correction on the horizon?
The key to deciphering Bitcoin’s next steps lies in technical analysis. Let’s dive deeper into the charts to identify critical price action signals.
Detailed Analysis
Weekly Timeframe Analysis
Summary
- The weekly MACD has formed a death cross, indicating a potential trend reversal.
- Historically, past death crosses have led to sharp declines. However, this time, institutional inflows might provide downside protection.
- Whether BTC can hold its key support levels will determine the market’s next direction.
- If Bitcoin defies the death cross and maintains support while moving higher, this could signal the start of a new growth phase.
- The price action over the next few weeks will be crucial in shaping Bitcoin’s trajectory for the first half of 2025.
Daily Timeframe Analysis
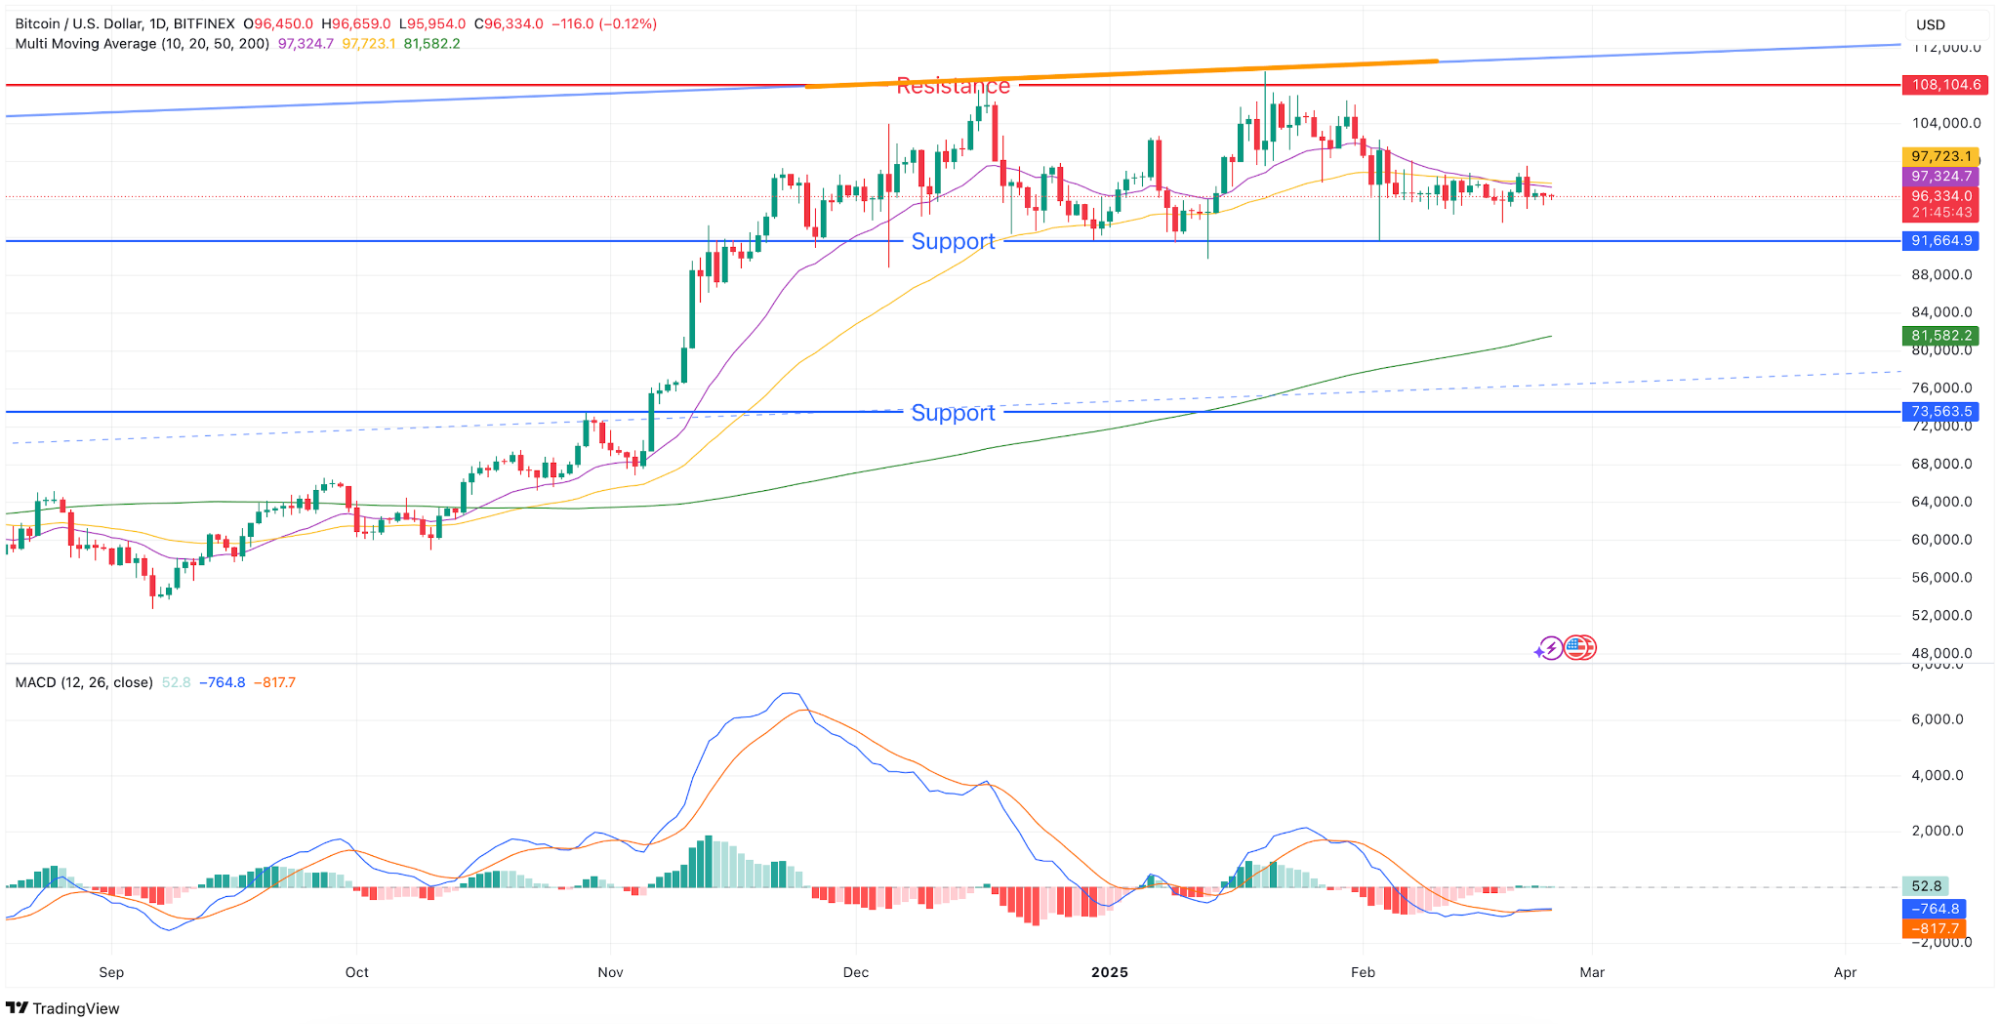
- Trend: Neutral
- Support Levels:
- $91,664.9 (Key Support)
- $81,582.2 (200MA Support)
- $73,563.5 (Lower Support)
- Resistance Level: $108,104.6
MACD Analysis
- The MACD histogram has turned slightly positive, showing early signs of bearish divergence.
- However, a confirmed trend reversal has yet to be established.
Moving Averages
- BTC is trading just below the 50MA ($97,723.1), indicating mild downward pressure.
- The 200MA ($81,582.2) serves as a strong long-term support level, with significant buying interest expected at the 200EMA.
Summary
- On the daily chart, BTC remains within a neutral trend, moving between key support and resistance levels.
- A break above $97,723.1 could trigger a bullish scenario, while a drop below $91,664.9 would signal further downside risk.
4-Hour Timeframe Analysis
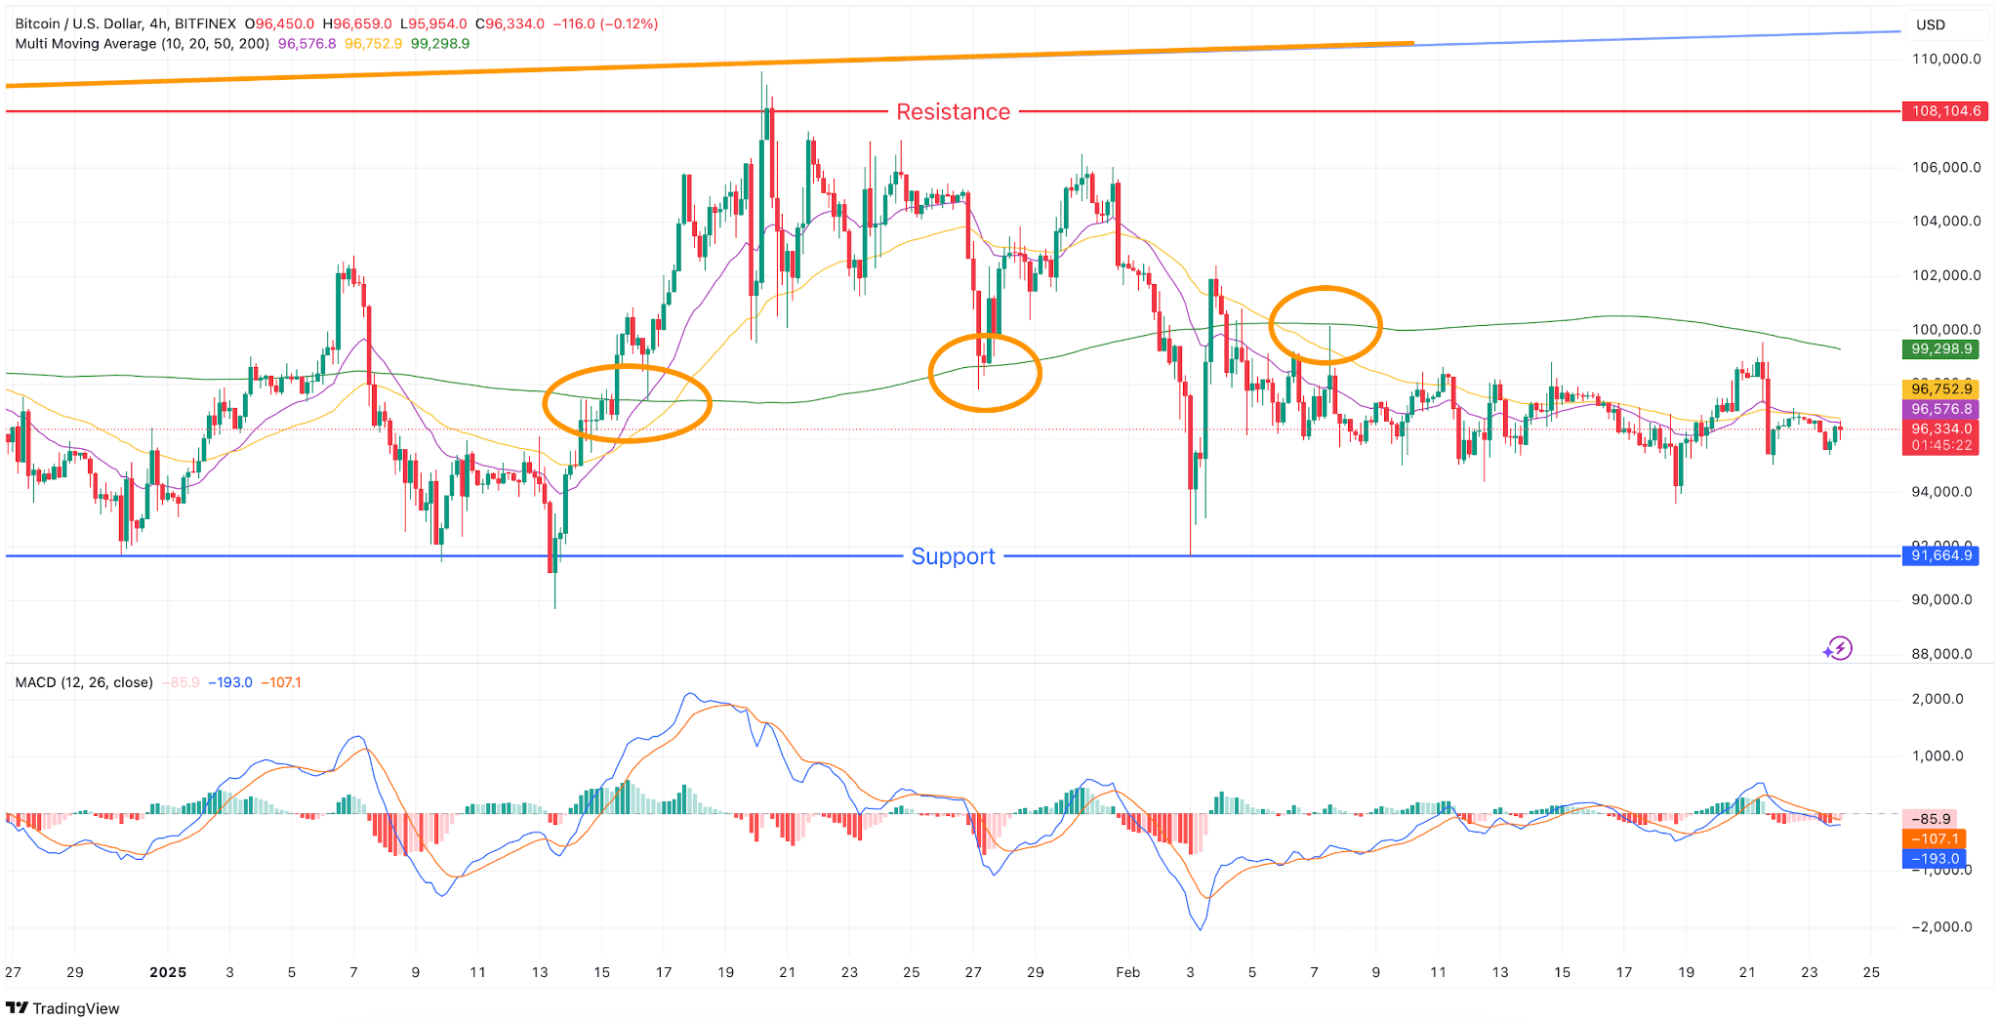
- Trend: Neutral
- Support Level: $91,664.9
- Resistance Levels: $108,104.6 (Major Resistance) and 200EMA
MACD Analysis
- The MACD histogram is losing momentum, raising the possibility of a bearish crossover.
Moving Averages
BTC is trading below both the 50MA ($96,752.9) and the 200MA ($99,298.9), keeping the short-term bearish pressure intact.
Summary
- On the 4-hour chart, BTC faces short-term bearish pressure.
- A break above $96,752.9 could shift momentum bullish, but failure to reclaim the 200MA would strengthen selling pressure.
Conclusion
Bitcoin is at a critical juncture. The weekly chart signals a growing risk of correction, yet institutional support may cushion the downside.
- On the daily and 4-hour timeframes, BTC maintains a neutral trend, lacking clear direction.
- The key bullish trigger is a break above the $108,104.6 resistance zone.
- A drop below $91,664.9 would increase the risk of further downside movement.
The key levels to watch:
- $97,723.1 (Daily 50MA Breakout Level) → A move above could ignite bullish momentum.
- $91,664.9 (Critical Support) → A breakdown could trigger extended selling.
With the market entering a decisive phase, traders must closely monitor price action and adapt their strategies accordingly.
Beginner Friendly Glossary
Whale: In the cryptocurrency market, a “whale” refers to an individual or entity that holds a large amount of a particular cryptocurrency, possessing the potential to influence market prices.
Interest Rate Cut: This occurs when the Federal Reserve (FRB) lowers its policy interest rate, leading to reduced borrowing costs. Such a move aims to stimulate economic activity and may encourage the flow of funds into risk assets.
ETF (Exchange-Traded Fund): An investment fund traded on stock exchanges, much like individual stocks. ETFs hold assets such as stocks, commodities, or bonds and offer investors a way to diversify their portfolios.
Bearish Divergence: A technical analysis phenomenon where, despite rising prices, momentum indicators (e.g., MACD or RSI) show a downward trend. This suggests a potential reversal to a downward price movement.
DISCLAIMER: THE CONTENT PROVIDED IN THIS ARTICLE IS FOR INFORMATIONAL PURPOSES ONLY AND SHOULD NOT BE CONSIDERED FINANCIAL, LEGAL, OR INVESTMENT ADVICE. CRYPTOCURRENCY INVESTMENTS CARRY A HIGH DEGREE OF RISK AND MAY NOT BE SUITABLE FOR EVERY INVESTOR. PAST PERFORMANCE DOES NOT GUARANTEE FUTURE RESULTS. THIS ANALYSIS IS INTENDED PURELY AS AN OBSERVATION OF SPECIFIC PRICE LEVELS AND TRENDS TO AID IN UNDERSTANDING POTENTIAL MARKET DIRECTIONS. YOU ARE ENCOURAGED TO DO YOUR OWN RESEARCH AND CONSULT WITH A LICENSED PROFESSIONAL BEFORE MAKING ANY FINANCIAL DECISIONS. THE INFORMATION HEREIN IS CURRENT AS OF THE PUBLICATION DATE AND MAY CHANGE WITHOUT NOTICE.