KEY INSIGHTS
- The BTC/USD pair exhibits a neutral trend on the daily timeframe, with bullish momentum indicated on shorter timeframes.
- Key support and resistance levels are at $91,677.6 and $108,104.6, respectively.
- MACD-based signals such as Golden Cross and Dead Cross highlight mixed momentum across timeframes.
Introduction
Review of the Previous Week:
Last week, Bitcoin (BTC/USD) held a neutral trend, moving between $96,241.4 and $91,677.6. The price dipped to $94,300 (-2.6%), influenced by rising U.S. bond yields and a stronger dollar. Interestingly, Bitcoin’s movement closely aligned with U.S. stock trends, underlining its increasing sensitivity to global market dynamics.
Market Changes Since Last Week:
This week, the cryptocurrency market was electrified by major developments that have everyone talking. Stealing the spotlight is the “TRUMP” meme coin, linked to President-elect Donald Trump. In just 48 hours, this token skyrocketed to an astounding $71 billion market cap, securing its place as the 15th largest cryptocurrency worldwide. The surge is powered by widespread speculation that Trump’s upcoming administration will champion crypto-friendly policies, reigniting investor excitement across the board.
XRP also made waves this week, edging closer to the critical $4 mark. Bolstered by strong technical patterns, this potential breakout has solidified XRP’s position as one to watch for traders seeking the next big move. On the other hand, Bitcoin reminded the market why it’s called “digital gold.” Despite a sharp $6,000 drop earlier in the week, Bitcoin held firm above the $100,000 mark, showcasing its enduring strength and appeal as a trusted asset for both institutional and retail investors.
These developments underscore the growing anticipation surrounding President-elect Trump’s policies and their potential impact on the crypto market. As optimism builds, investors are keeping a close eye on how this momentum could shape the next chapter of cryptocurrency’s exciting evolution.
Detailed Analysis
Daily Chart: Key Price Levels
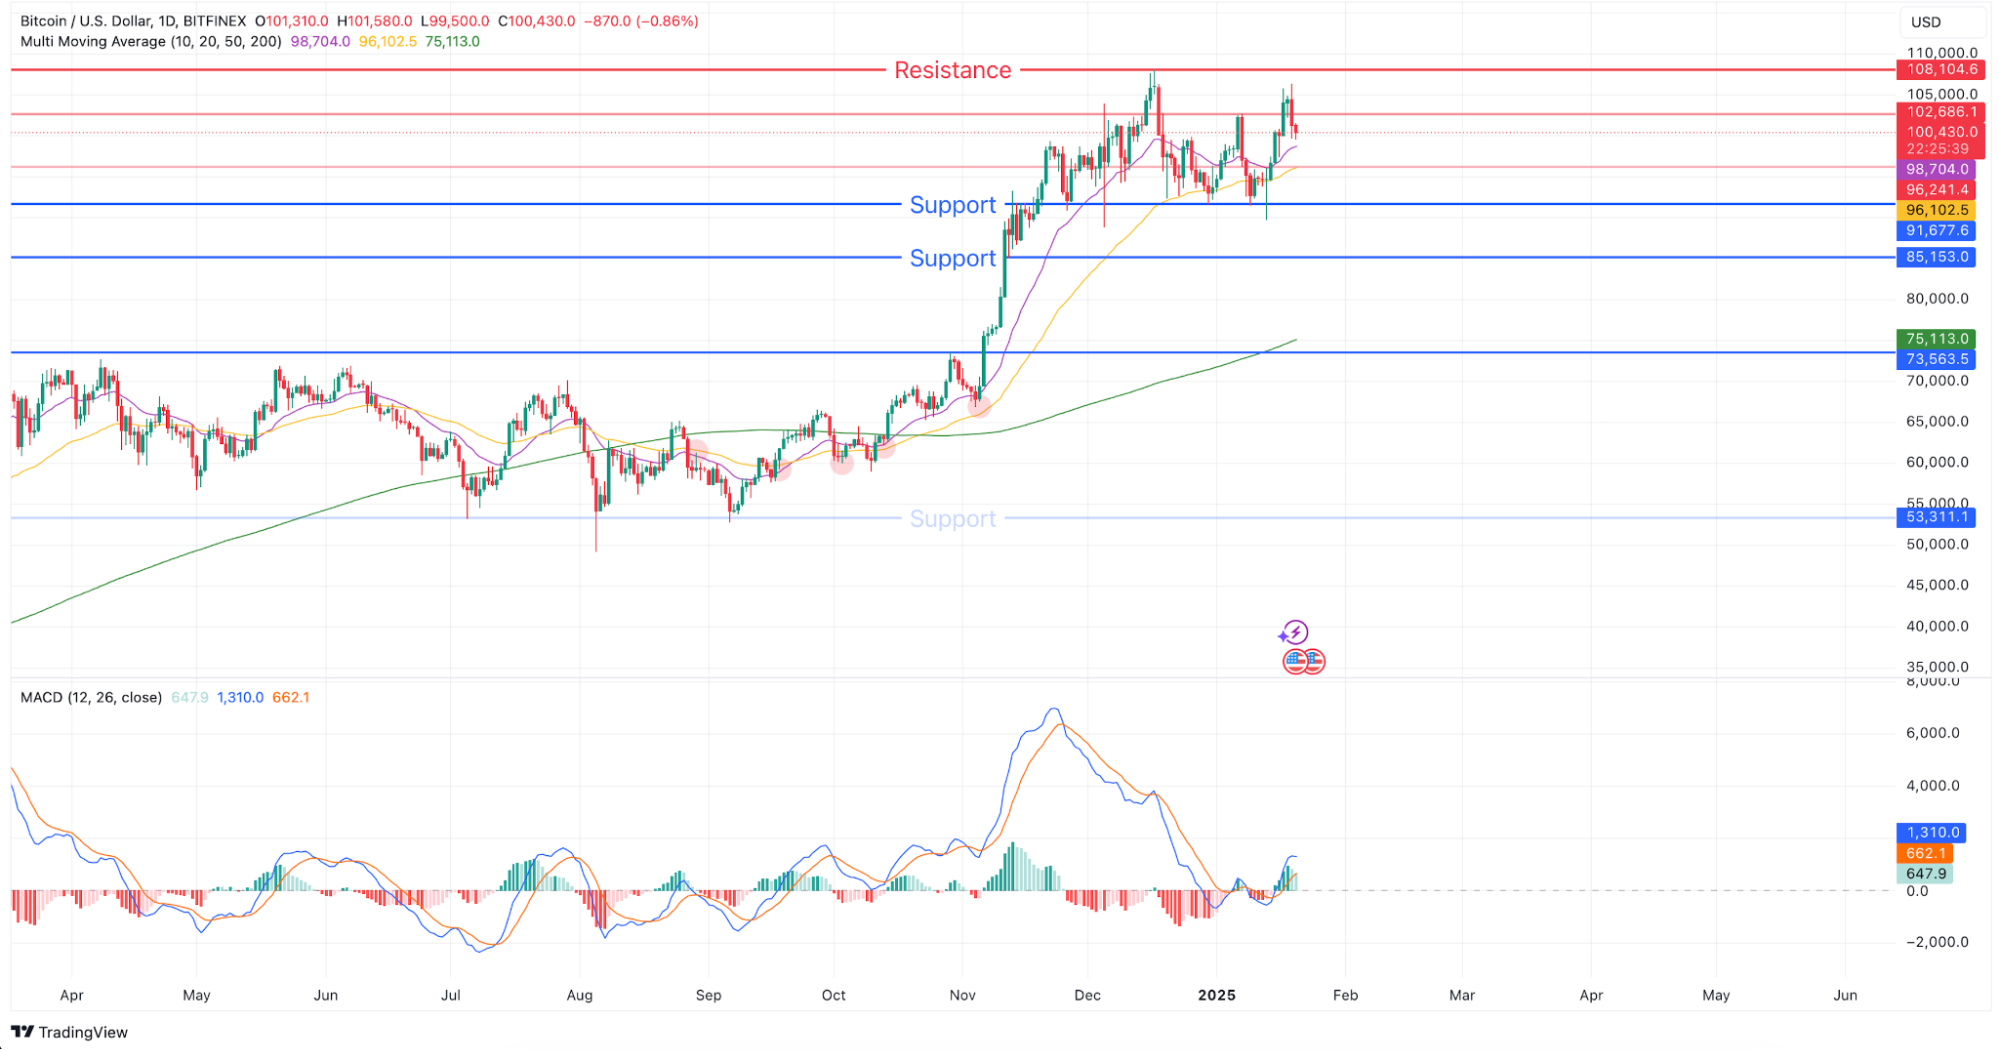
- Trend: Neutral
- Support Level: $91,677.6
- Resistance Level: $108,104.6
- MACD Analysis: Positive histogram with a Golden Cross (MACD), indicating potential bullish momentum. The MACD line is 647.9 points above the signal line.
- Moving Averages: The current price ($100,430) is above the 50-day MA ($96,102.5) by approximately 4.5% and remains significantly above the 200-day MA ($75,113), reflecting strong long-term upward potential.
Summary
The daily chart shows a neutral trend with upward potential. The MACD-based Golden Cross suggests bullish momentum, though resistance at $108,104.6 could limit further gains.
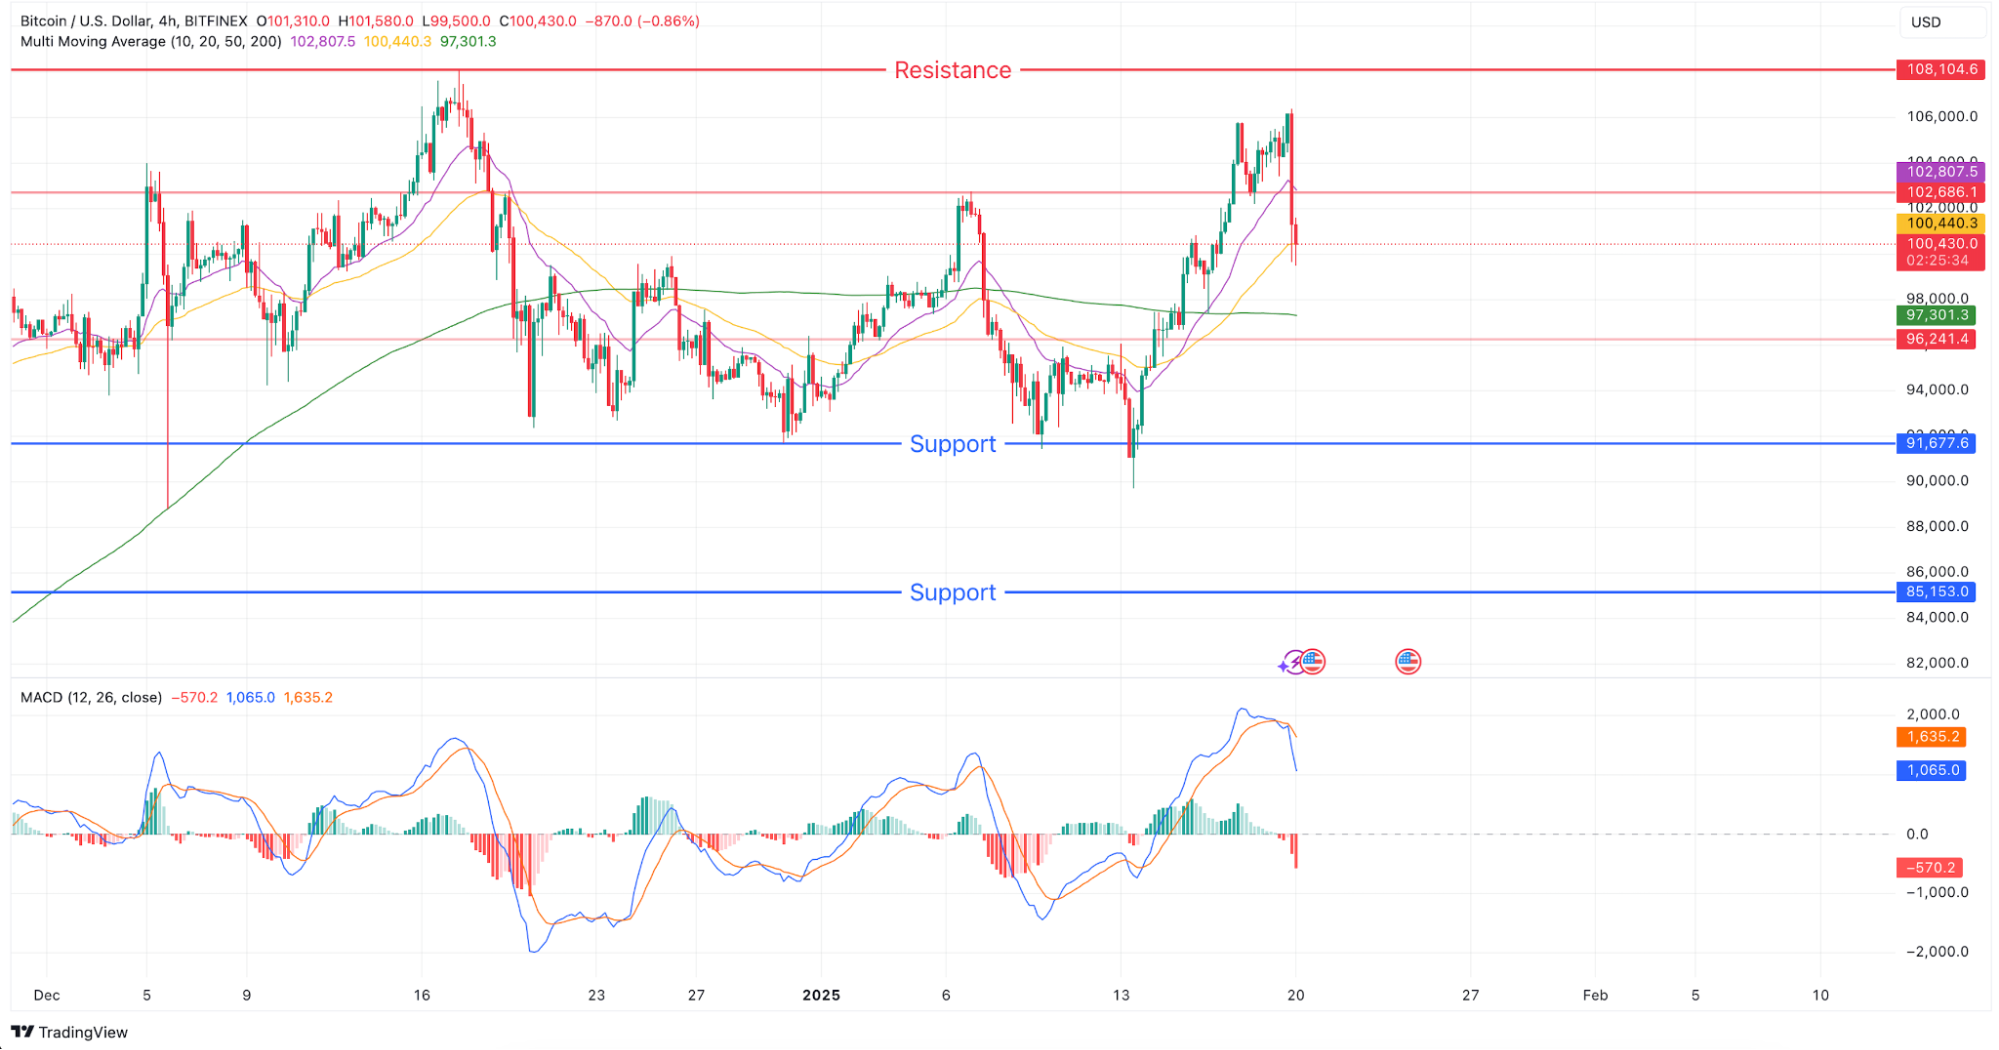
- Trend: Up
- Support Level: $96,241.4
- Resistance Level: $108,104.6
- MACD Analysis: Negative histogram (-570.2) with a Dead Cross (MACD), reflecting short-term bearish momentum within an upward trend.
- Moving Averages: The current price ($100,430) is slightly below the 50-period MA ($100,440.3) but approximately 3% above the 200-period MA ($97,301.3).
Summary
The 4-hour chart indicates upward momentum tempered by short-term bearish signals on the MACD. Resistance at $108,104.6 is a key level for confirming the trend’s strength.
1-Hour Chart: Key Price Levels
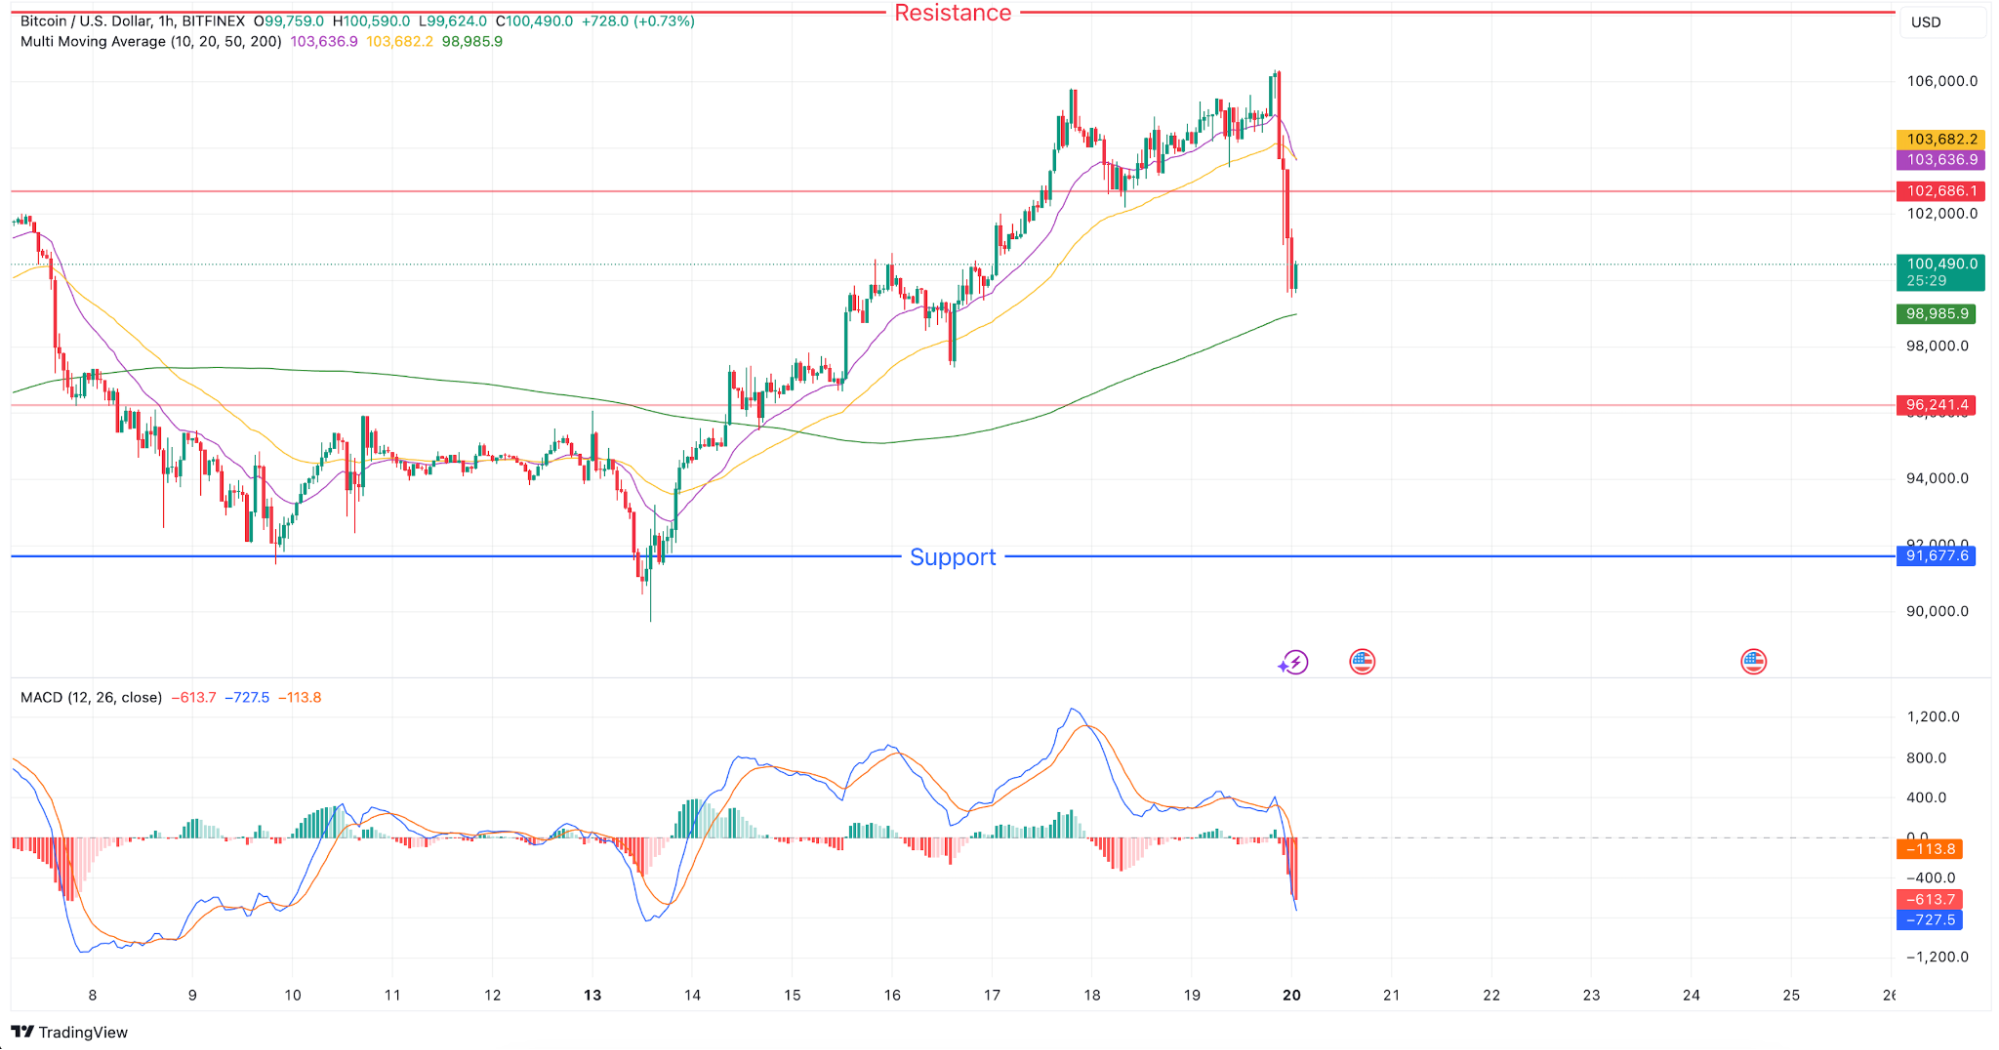
- Trend: Up
- Support Level: $96,241.4
- Resistance Level: $108,104.6
- MACD Analysis: Negative histogram (-613.7) with a Dead Cross (MACD), signaling bearish pressure despite the upward trend.
- Moving Averages: The current price ($100,430) is below the 50-period MA ($103,682.2) by approximately 3.1% and slightly above the 200-period MA ($98,985.9) by 1.5%, reflecting mixed short-term signals.
Summary
The 1-hour chart reflects upward momentum with caution. The MACD-based Dead Cross and resistance at $108,104.6 suggest a potential pause in upward action.
Conclusion
Bitcoin’s technical analysis reveals a neutral daily trend with upward potential, supported by a MACD-based Golden Cross and the price’s position above key moving averages. The 4-hour and 1-hour charts show upward trends, but short-term bearish pressures, such as MACD Dead Crosses, suggest caution. Traders should focus on resistance at $108,104.6, as breaking this level could confirm further bullish movement, while holding support at $91,677.6 is essential for maintaining current stability.
Beginner Friendly Glossary
MACD (Moving Average Convergence Divergence): A momentum indicator showing the relationship between two moving averages.
Golden Cross (MACD): A bullish signal on the MACD where the MACD line crosses above the signal line.
Dead Cross (MACD): A bearish signal on the MACD where the MACD line crosses below the signal line.
Support Level: A price level where downward movement is expected to pause.
Resistance Level: A price level where upward movement is expected to pause.
Moving Average (MA): A trend-following indicator that smooths out price data over a specified period.
Histogram: A graphical representation of the difference between the MACD line and the signal line.
Neutral Trend: A period of sideways movement with no clear upward or downward direction.
EMA (Exponential Moving Average): A moving average that gives more weight to recent prices.
Zero Line: The midpoint in MACD, indicating potential trend shifts.
DISCLAIMER: THE CONTENT PROVIDED IN THIS ARTICLE IS FOR INFORMATIONAL PURPOSES ONLY AND SHOULD NOT BE CONSIDERED FINANCIAL, LEGAL, OR INVESTMENT ADVICE. CRYPTOCURRENCY INVESTMENTS CARRY A HIGH DEGREE OF RISK AND MAY NOT BE SUITABLE FOR EVERY INVESTOR. PAST PERFORMANCE DOES NOT GUARANTEE FUTURE RESULTS. THIS ANALYSIS IS INTENDED PURELY AS AN OBSERVATION OF SPECIFIC PRICE LEVELS AND TRENDS TO AID IN UNDERSTANDING POTENTIAL MARKET DIRECTIONS. YOU ARE ENCOURAGED TO DO YOUR OWN RESEARCH AND CONSULT WITH A LICENSED PROFESSIONAL BEFORE MAKING ANY FINANCIAL DECISIONS. THE INFORMATION HEREIN IS CURRENT AS OF THE PUBLICATION DATE AND MAY CHANGE WITHOUT NOTICE.