KEY INSIGHTS
- RSI Returning to Neutral Levels: There is a growing likelihood of a new short-term range forming between $85,153 and $99,336.1.
- Breakout Above $99,336.1 is Key: This is a critical point for the potential resumption of the bullish trend.
- Role of the 200-Day Moving Average (4-Hour Chart): This indicator is likely to act as a pivotal factor for short-term trends and requires close attention.
Introduction
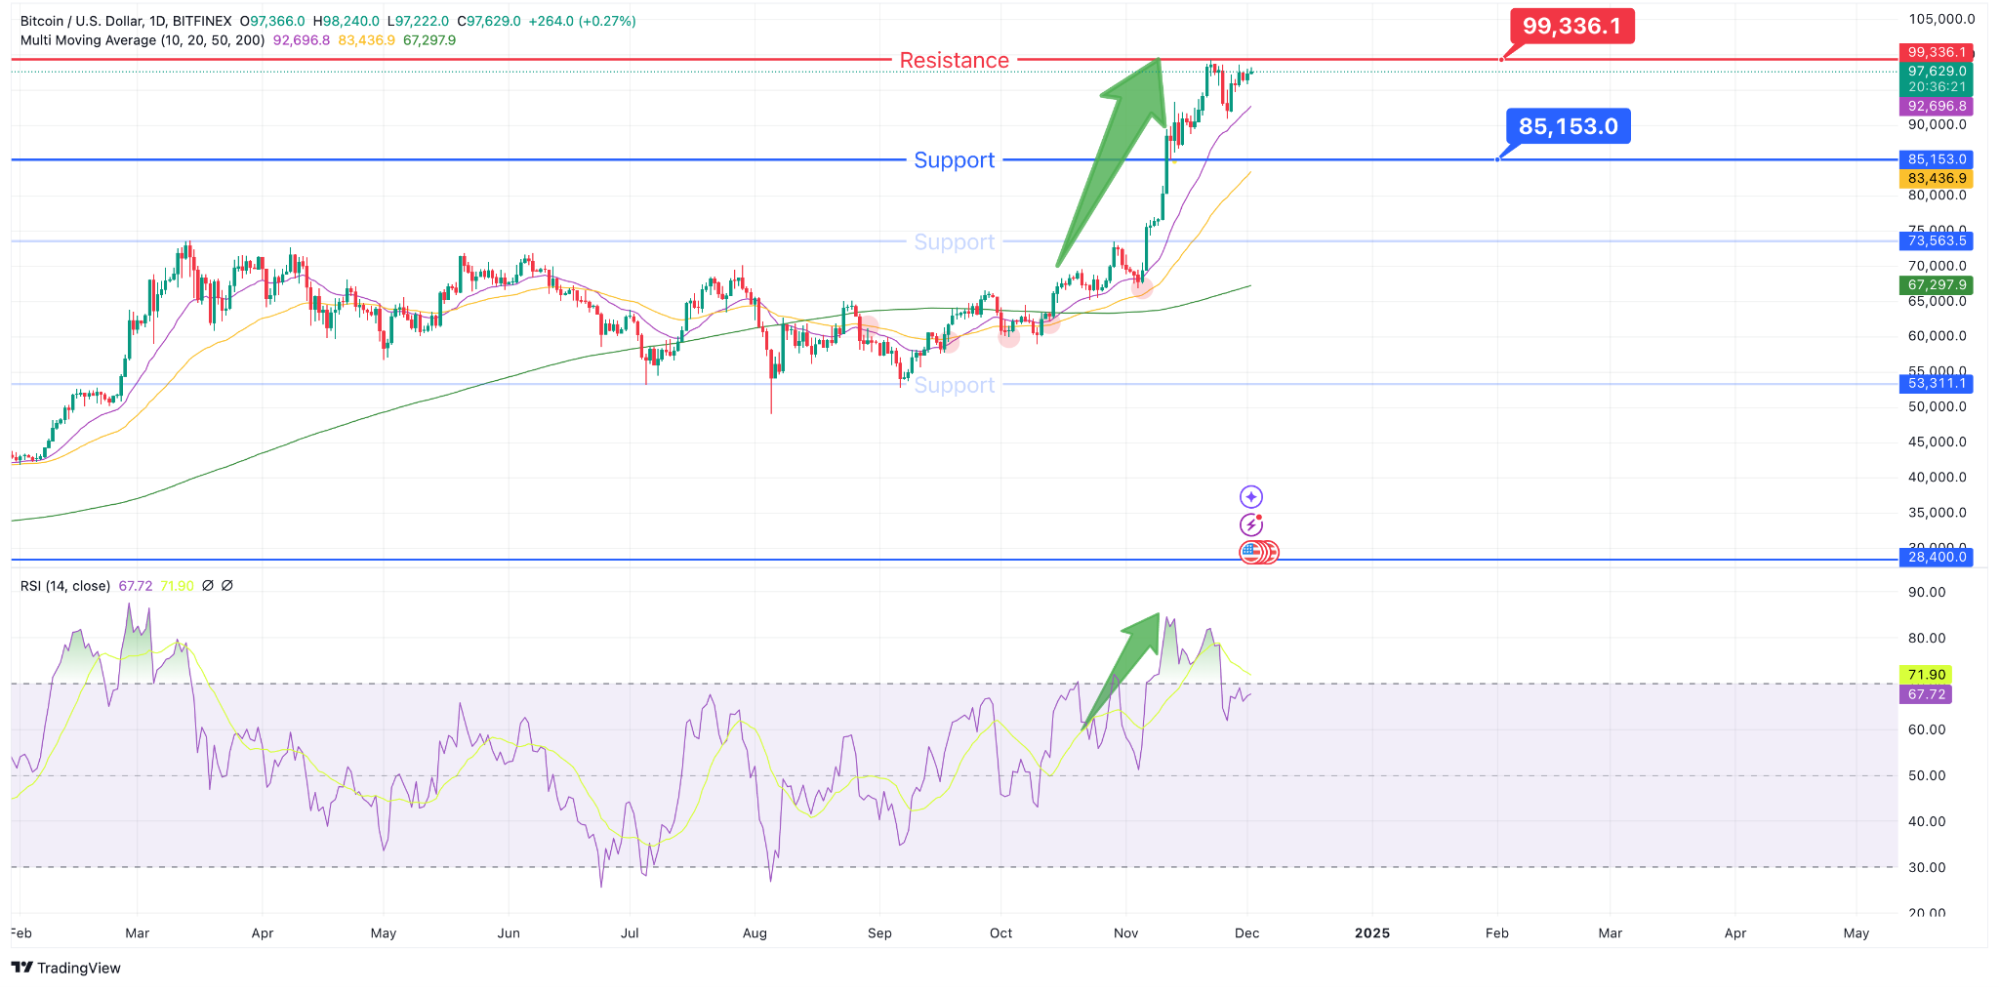
In our previous analysis (25 November 2024), we highlighted Bitcoin’s strong bullish momentum, culminating in an all-time high of $99,336.1. This momentum surpassed previous resistance levels. This surge was largely attributed to active institutional participation and supportive policies, such as the approval of BlackRock’s Bitcoin ETF, which boosted market confidence and provided fresh momentum for the cryptocurrency market.
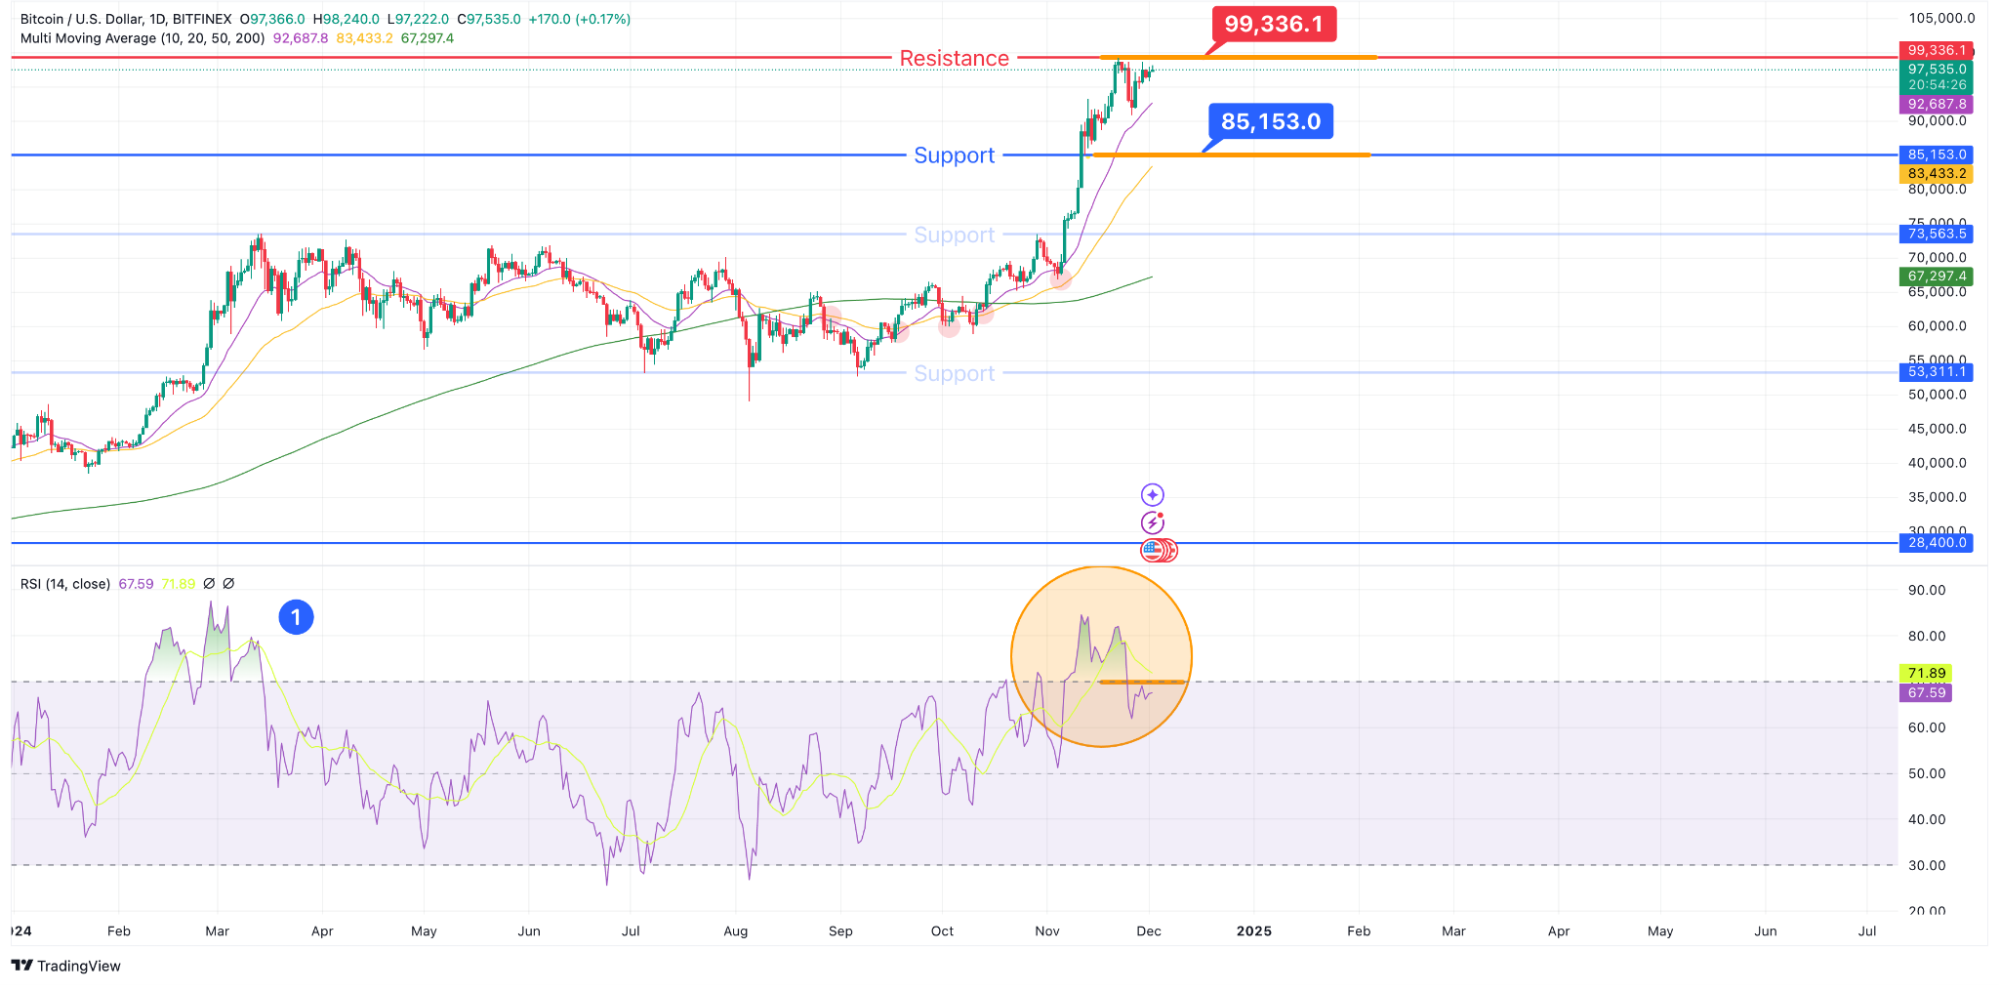
The Relative Strength Index (RSI), which previously signaled overbought conditions, began to retreat toward neutral territory. The role of the 200-day moving average on the 4-hour chart also gained prominence as Bitcoin approached key support levels, influencing short-term market dynamics.
Now, as we enter December, the focus shifts to whether Bitcoin can sustain its bullish momentum and breach the critical $100,000 mark or if it will consolidate further within its newly formed range. This week’s article revisits those movements while providing a deeper analysis of the current market conditions and the key factors that may influence Bitcoin’s next steps.
Price Review & Summary of Last Week’s Analysis
Last week’s analysis highlighted Bitcoin’s breakthrough of the $93,367.7 resistance level and its climb to a record high of $99,336.1. This sharp rise reflected strong buying pressure in the market, with the RSI hovering near 70, indicating sustained bullish momentum.
While a short-term range between $93,367.7 and $85,153 was initially anticipated, Bitcoin exceeded expectations, breaking past the range to establish new highs. This demonstrated that $93,367.7 no longer served as a significant resistance level. As a result, this week’s focus has shifted to the next critical levels: $99,336.1 as resistance and $85,153 as support.
Particularly, whether Bitcoin can hold above $85,153 or risks breaking below this support level has become the primary area of interest. By examining these price movements, this analysis aims to explore potential market scenarios, key price ranges, and the factors shaping trend formation in the days ahead.
Market Analysis & Price Action
Significant Price Movement Analysis
- RSI Movements:
The RSI is retreating from overbought levels toward neutral territory, signaling the possibility of a transition into a new range. - Key Price Levels:
- Resistance: $99,336.1 remains the critical level to watch for the continuation of the bullish trend.
- Support: $85,153 serves as the key downside level to monitor for potential corrections.
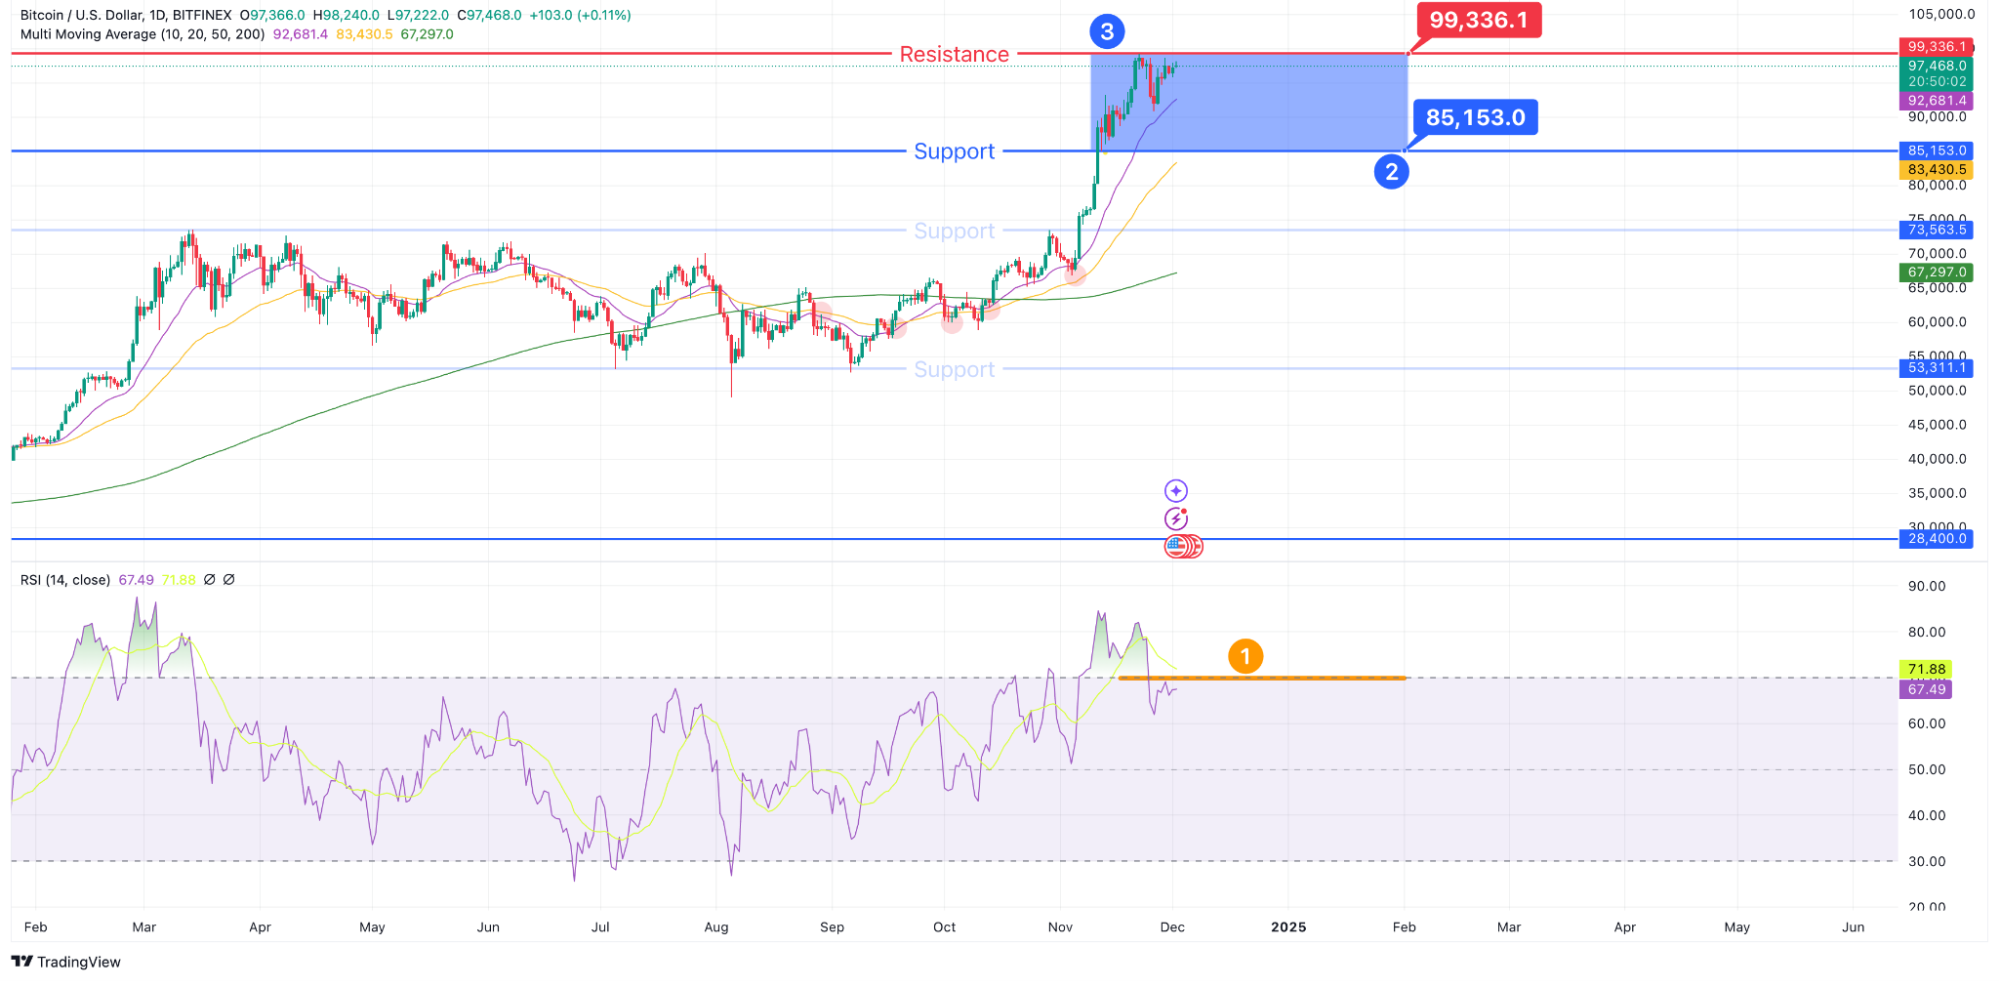
Range Dynamics
- Formation of a Range: Bitcoin appears to be forming a short-term range between $85,153 and 99,663.1.
Whether this range holds or a breakout occurs at either boundary will dictate the next trend. - Market Focus Points:
- Selling pressure tends to increase near the upper boundary, while buying interest is stronger at the lower boundary.
- Observing price movements within these levels can help evaluate short-term market direction.
- A breakout above $99,336.1 could signal a transition into a further bullish trend.
Detailed Analysis
Daily Chart: Overall Movements
- RSI Trends
The RSI is transitioning from overbought levels to a neutral range, suggesting that Bitcoin may enter a short-term correction phase. This indicates the need to closely monitor whether the support line holds. - Support
If the price falls below the $85,153 support level, the risk of further correction increases. - Resistance
Conversely, if the bullish trend regains momentum, Bitcoin is expected to test the $99,336.1 level.
- Key Price Levels to Watch:
- Resistance Line: $99,336.1
- Support Line: $85,153
4-Hour Chart: Key Price Levels
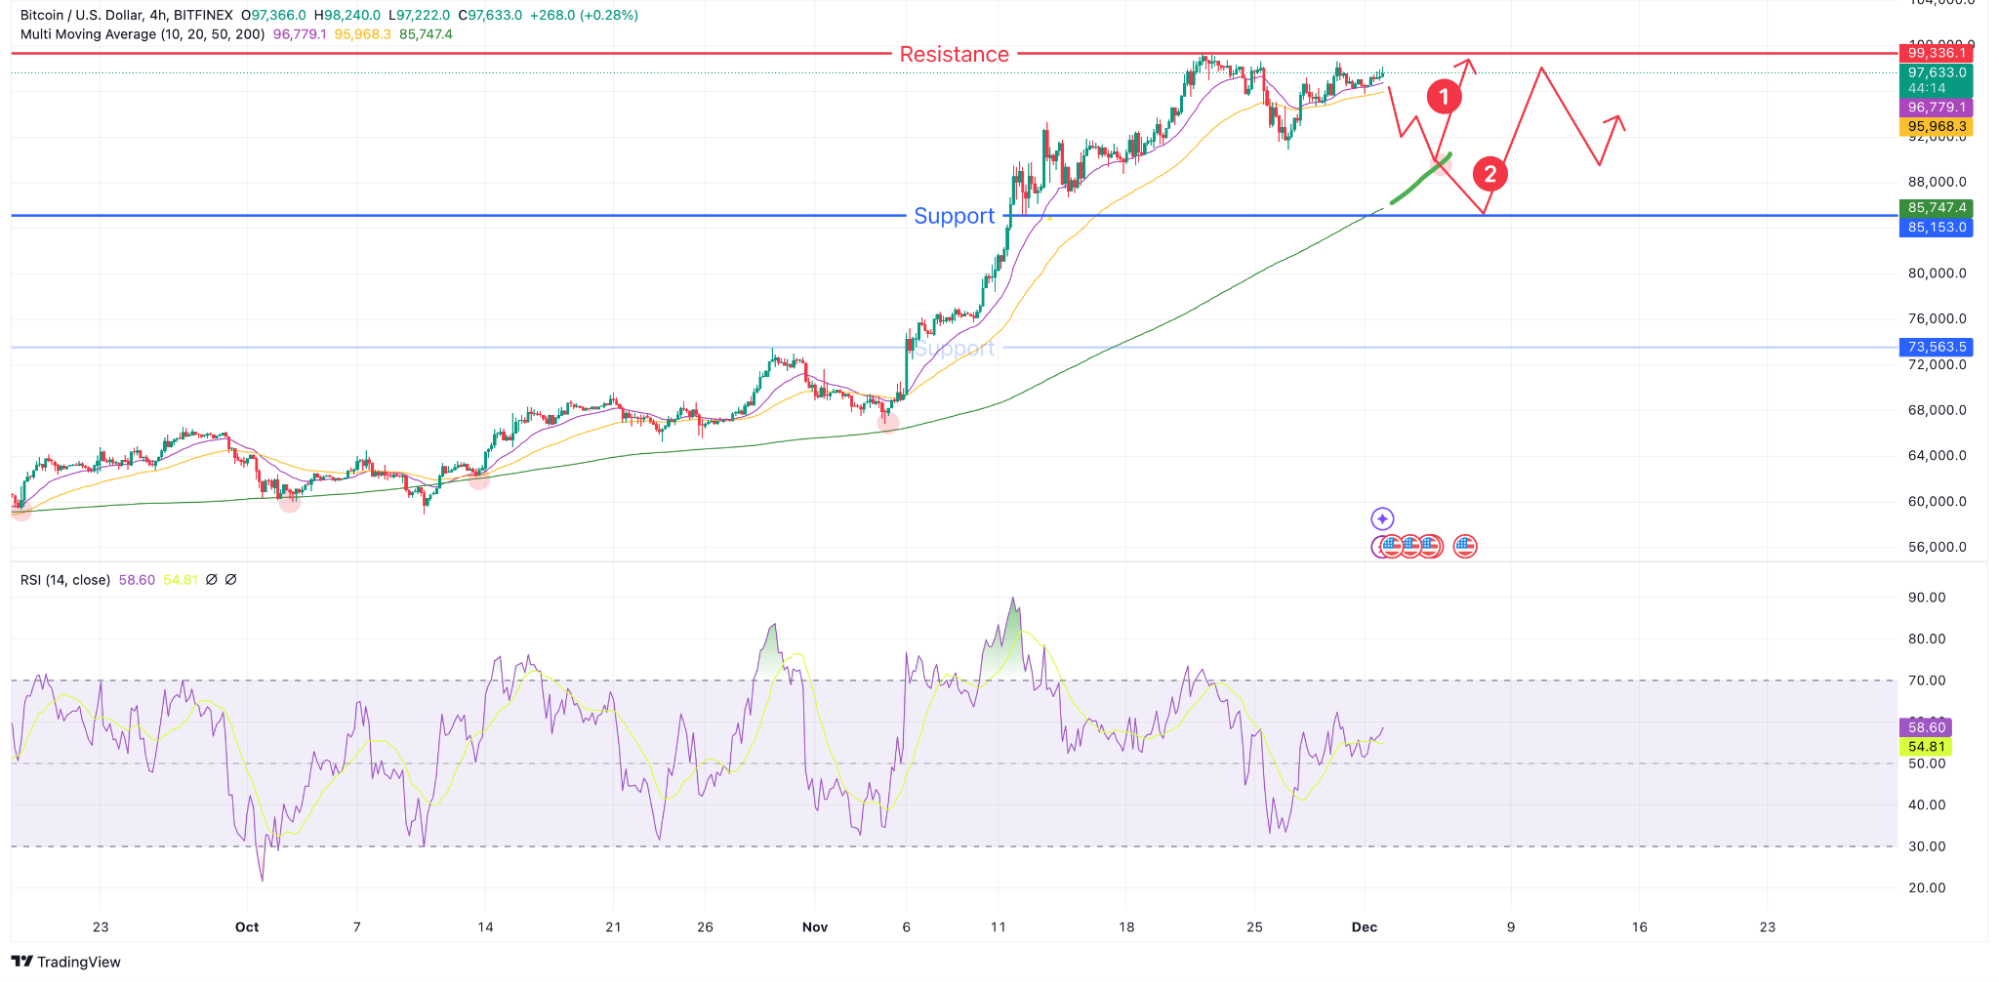
- 200-Day Moving Average
The 200-day moving average has proven to be a reliable indicator, as highlighted by the red circles in the image. Historically, it has provided strong guidance on price movements. This time, as the price approaches this level, close attention should be paid to how the market reacts. - Support
Should the 200-day moving average fail to hold, the next critical level to monitor is the support line at $85,153. There is a potential for a rebound at this level, which warrants careful observation.
- Key Points to Watch:
- Price action around the 200-day moving average
- Support level at $85,153
Conclusion
Bitcoin is currently trading within a short-term range between $85,153 (support) and $99,336.1 (resistance). The trading volume and investor activity within this range will play a pivotal role in shaping the next trend. Whether Bitcoin sustains this range or breaks out will determine the future trajectory of the market.
By evaluating the interplay of RSI movements, range dynamics, and the 200-day moving average, traders and investors can gain a clearer understanding of the market’s direction. Careful monitoring of key price levels and potential breakout scenarios is essential for making informed decisions in this evolving environment.
This December, as the year-end approaches, Bitcoin’s movements will define its narrative in the cryptocurrency market. Whether driven by institutional demand, technical factors, or broader macroeconomic influences, Bitcoin’s path forward promises to remain a focal point for traders and investors worldwide.
Beginner Friendly Glossary
- Moving Averages (200-day Moving Average)
The 200 Day Moving Average is a long term moving average that helps determine the overall health of a stock. A 200 Day moving average is calculated by taking the closing prices for the last 200 days of any security, summing them together and dividing by 200.
Learn more here - Trading Ranges
Ranges in crypto trading refer to the fluctuation of a cryptocurrency’s price within a specific high and low boundary. Understanding and utilizing ranges can help traders identify potential entry and exit points for their trades.
Learn more here - Resistance Lines
Resistance is the opposite of support. Prices move up because there is more demand than supply. As the prices move higher, there will come a point when selling will overwhelm buying.
Learn more here - Support Lines
In a downtrend, prices fall because there is an excess of supply over demand. The lower prices go, the more attractive they become to those waiting on the sidelines to buy the shares. At some level, demand that would have been slowly increasing will rise to the level where it matches supply. At this point, prices will stop falling.
Learn more here
- Bullish
The term “Bullish” refers to a positive sentiment for a particular investment or the general market. This refers to a general expectation that the investment or market will grow.
Learn more here
DISCLAIMER: THE CONTENT PROVIDED IN THIS ARTICLE IS FOR INFORMATIONAL PURPOSES ONLY AND SHOULD NOT BE CONSIDERED FINANCIAL, LEGAL, OR INVESTMENT ADVICE. CRYPTOCURRENCY INVESTMENTS CARRY A HIGH DEGREE OF RISK AND MAY NOT BE SUITABLE FOR EVERY INVESTOR. PAST PERFORMANCE DOES NOT GUARANTEE FUTURE RESULTS. THIS ANALYSIS IS INTENDED PURELY AS AN OBSERVATION OF SPECIFIC PRICE LEVELS AND TRENDS TO AID IN UNDERSTANDING POTENTIAL MARKET DIRECTIONS. YOU ARE ENCOURAGED TO DO YOUR OWN RESEARCH AND CONSULT WITH A LICENSED PROFESSIONAL BEFORE MAKING ANY FINANCIAL DECISIONS. THE INFORMATION HEREIN IS CURRENT AS OF THE PUBLICATION DATE AND MAY CHANGE WITHOUT NOTICE.