KEY INSIGHTS
- Bitcoin Reaches New Heights: Bitcoin has surpassed its previous all-time high, reaching $93,367.7, fueled by strong institutional support and favorable political developments, including Trump’s pro-crypto policies.
- Consolidation Phase: After reaching new highs, Bitcoin is now in a consolidation phase, with price movements contained within the range of $85,056.7 to $93,367.7.
- Key Levels to Monitor: The $85,056.7 and $73,563.5 levels remain critical support and resistance zones. A break below $85,056.7 could signal a potential correction.
- RSI Insights: The RSI has dropped below 70, suggesting a cooling of the upward momentum. Watching RSI patterns will be crucial for predicting the next phase of price movement.
- Potential for Bullish Continuation: If Bitcoin holds above the current range, it could break past $93,367.7 and head toward the $100,000 mark, continuing its bullish trend.
Introduction
In last week’s analysis (11 Nov 2024), we discussed Bitcoin’s breakout above the $81,722.677 mark, fueled by institutional support, including the approval of BlackRock’s iShares Bitcoin Trust (IBIT) and the strengthening of Bitcoin’s case as a store of value. We also noted the important role that political developments, such as Donald Trump’s pro-crypto stance, were playing in driving optimism within the cryptocurrency market.
Fast forward to this week, Bitcoin has not only surpassed $84,671.1 but has also achieved an all-time high of $93,367.7 in 14 Nov 2024. This surge is largely attributed to Trump’s re-election as U.S. President and his plans to establish the U.S. as a global leader in digital currencies, which included appointing Elon Musk to the Department of Government Efficiency. These developments have instilled investor confidence, propelling Bitcoin’s market capitalization to an impressive $1.5 trillion.
Now, we must ask: Is this bullish momentum sustainable, or is a period of consolidation or correction ahead? In this week’s analysis, we’ll evaluate Bitcoin’s recent performance, assess the technical levels at play, and explore the potential scenarios that could unfold.
Price Review & Recap of Last Week’s Analysis
Last week, we observed Bitcoin breaking above the $73,563.5 resistance level, with the Relative Strength Index (RSI) pushing into overbought territory, signaling the potential for further price gains. Bitcoin’s momentum continued as we anticipated, reaching a near-term target of $84,671.1, with some fluctuations along the way. We also identified two potential scenarios: one in which Bitcoin broke through key resistance and one where a pullback to the $73,563.5 level could occur.
Now, after surpassing that target and achieving a new all-time high of $93,367.7, it’s essential to consider whether Bitcoin will maintain its bullish trend or face a consolidation phase. Let’s break down the technical analysis further and assess the current market environment.
Market Analysis & Price Action
Significant Price Movement Analysis
- All-Time High Achieved: Bitcoin has surpassed $84,671.1 and reached a new all-time high of $93,367.7, confirming the bullish momentum we predicted last week.
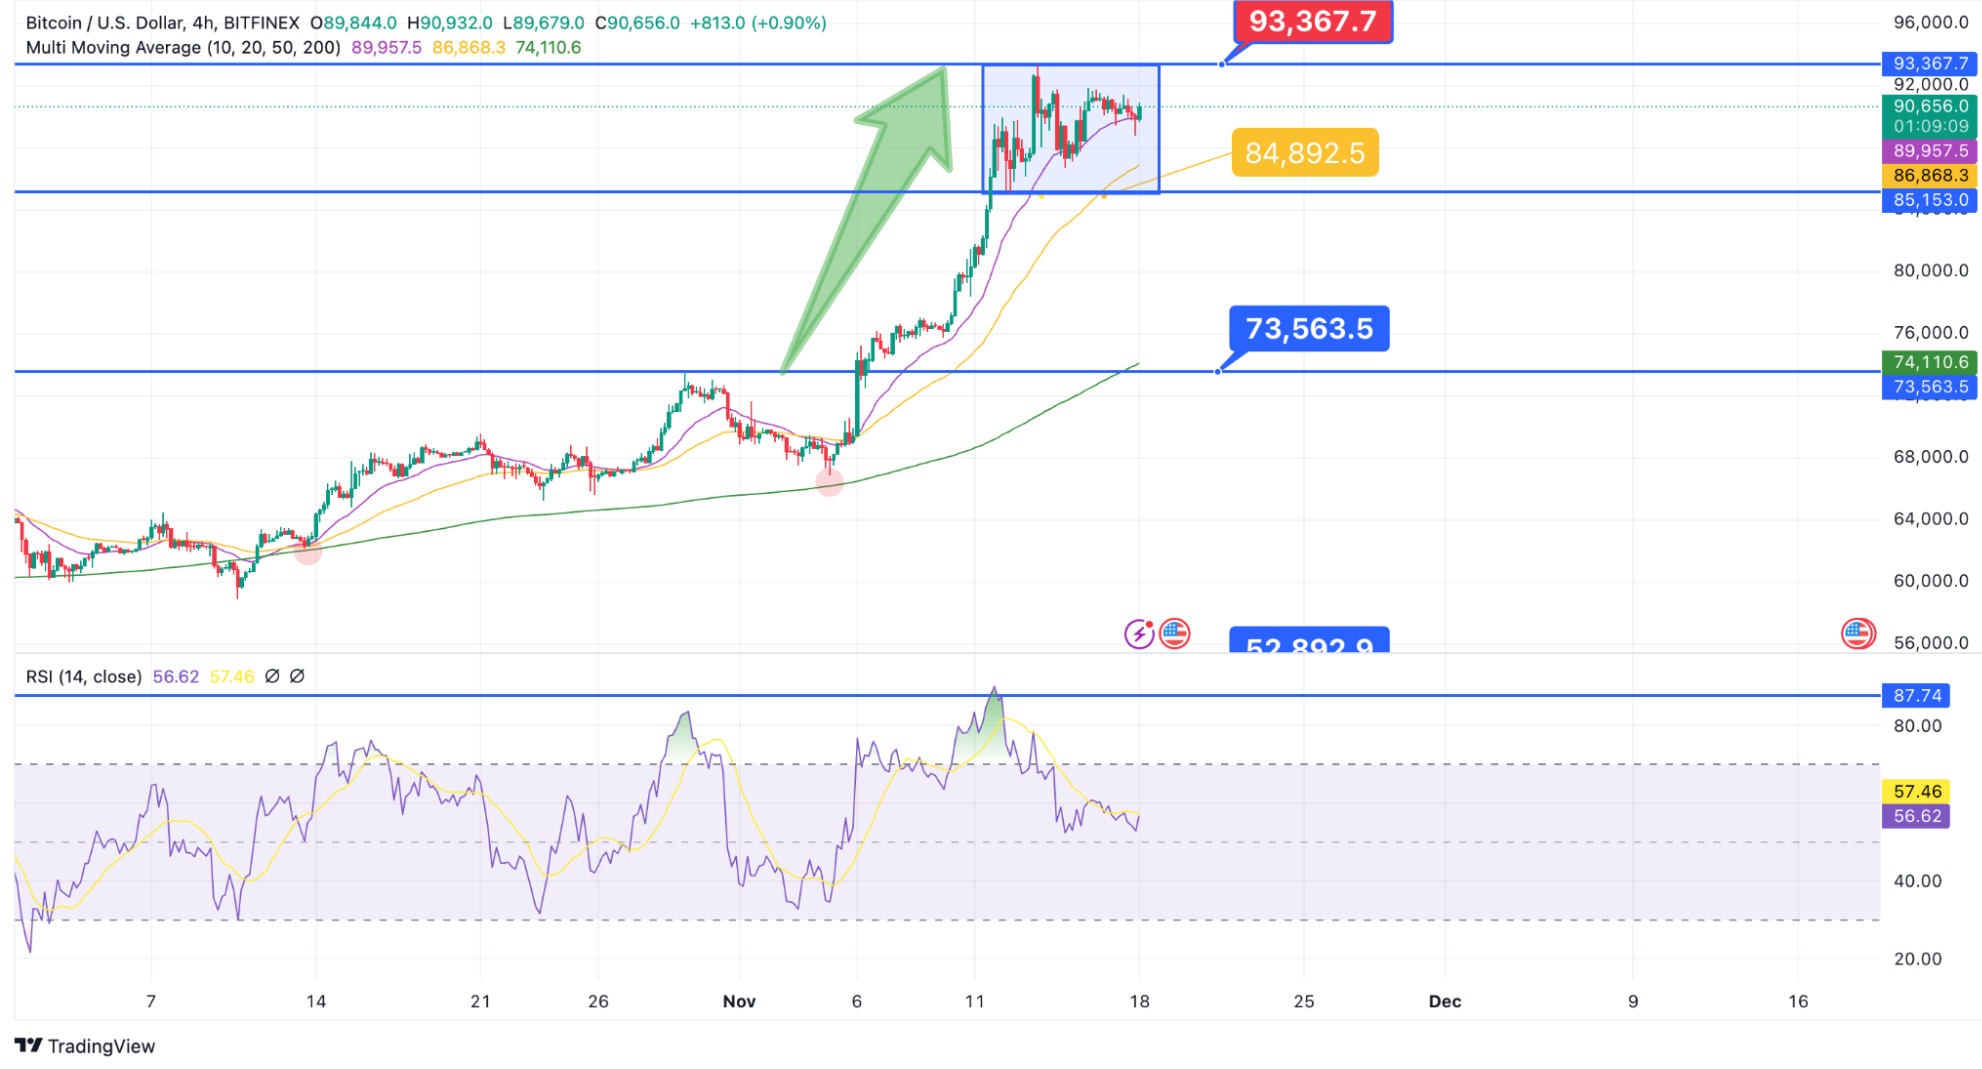
- Short-Term Consolidation: Currently, the market appears to be in a short-term consolidation phase, with the 4-hour RSI falling below 70, indicating the potential for a range-bound market in the near future (blue box). A new range between $85,056.7 and $93,367.7 has formed.
Range Dynamics
- Range Boundaries: The current range is observed between $85,056.7 and $93,367.7, signaling that Bitcoin is trading within these boundaries until a decisive breakout or breakdown occurs.
- Important Price Levels: The $73,563.5 level remains a key point of interest for potential support, while the $77,341.3 zone has emerged as another potential level to monitor based on previous price action and technical dynamics.
Detailed Analysis
Daily Chart: Price Movements
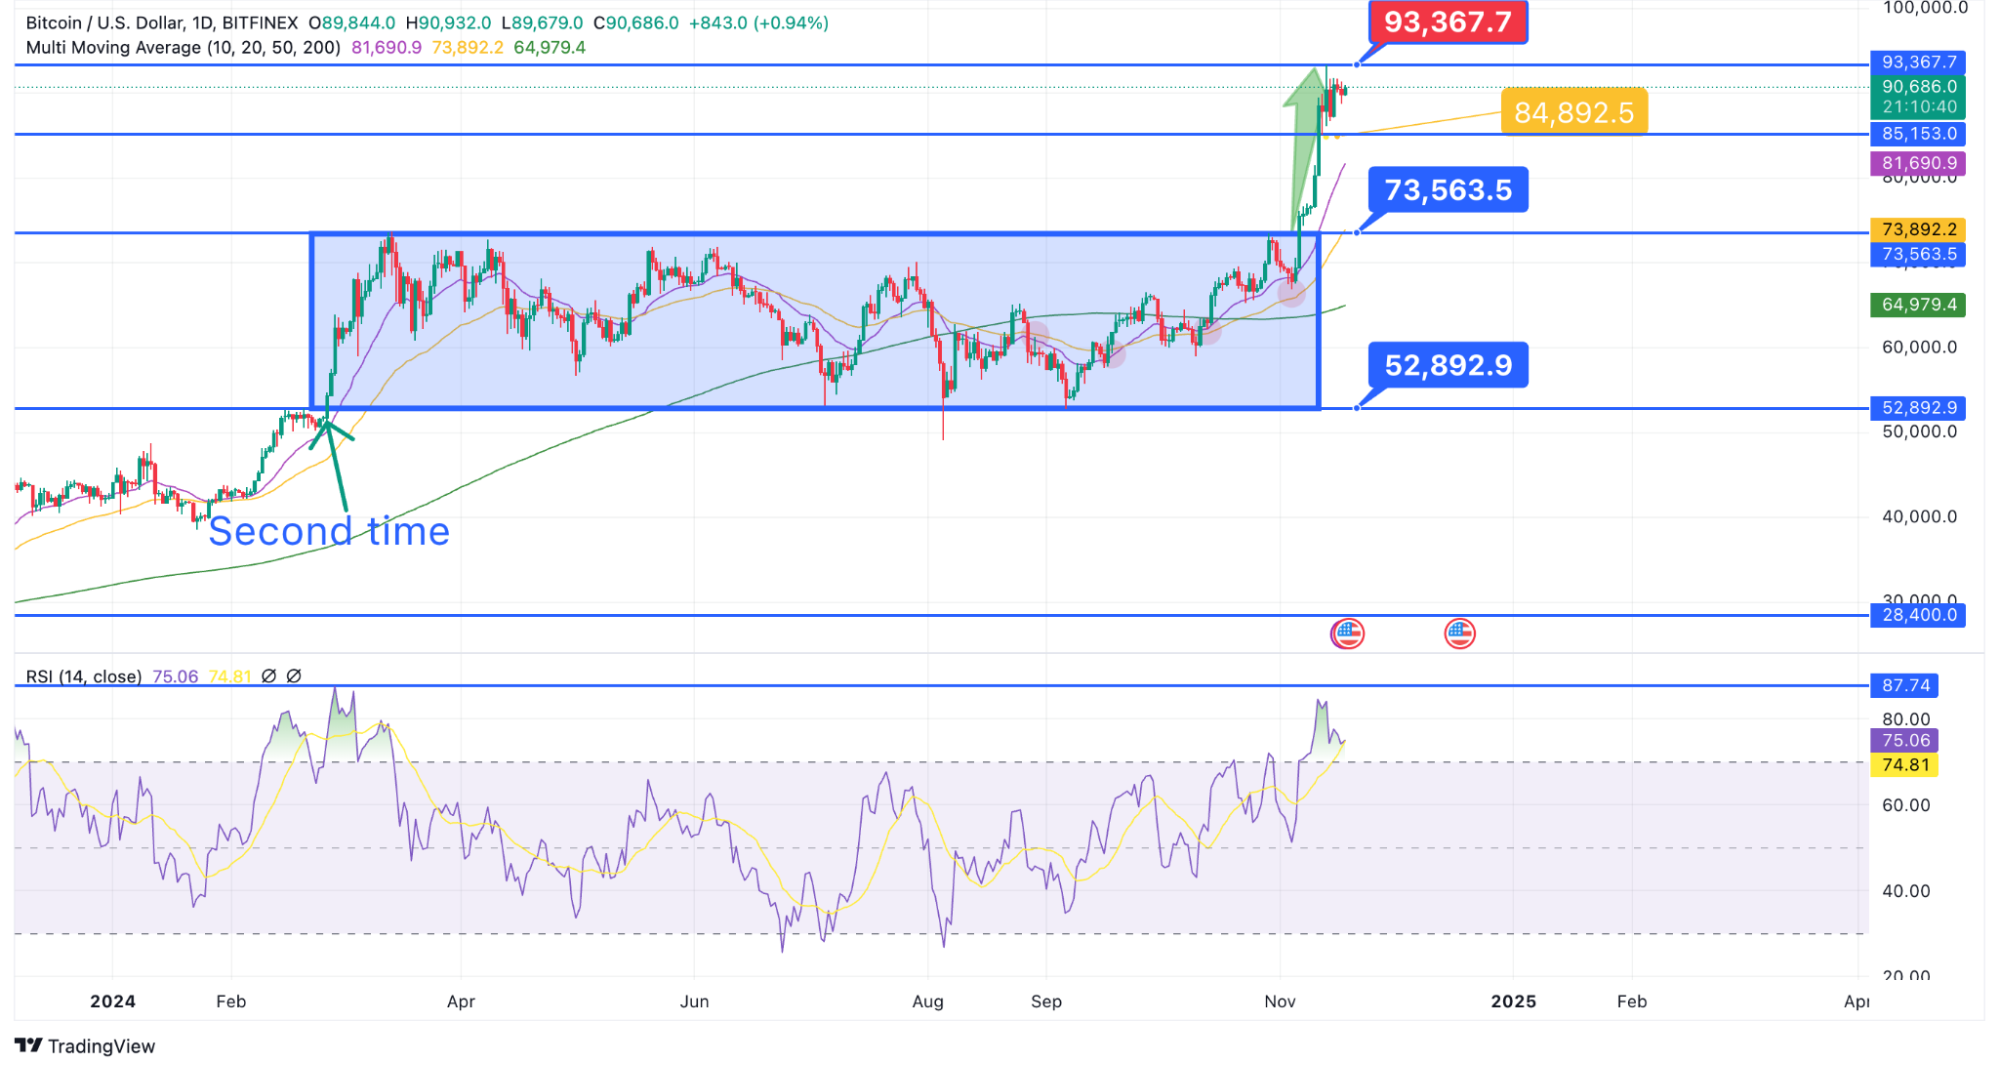
From March to early November 2024, Bitcoin remained in a range-bound market (blue box), oscillating between support and resistance levels. However, in the last few weeks, Bitcoin transitioned into an uptrend, pushing past significant resistance points like $73,563.5 and reaching new highs. The market’s direction is clear, but it’s important to monitor if Bitcoin can sustain this momentum beyond its all-time high.
Key Level to Watch: The $73,563.5 support level continues to be crucial. This level has been tested multiple times, and any dip back to this area would likely draw significant attention from both buyers and sellers.
4-Hour Chart: Range Analysis
Currently, Bitcoin’s price is confined between the upper boundary at $93,367.7 and the lower boundary at $85,056.7 (blue box). This suggests a potential consolidation phase in the short term, where price movement is limited. It’s essential to observe how these boundaries play out over the next few days to identify whether a breakout or breakdown is more likely.
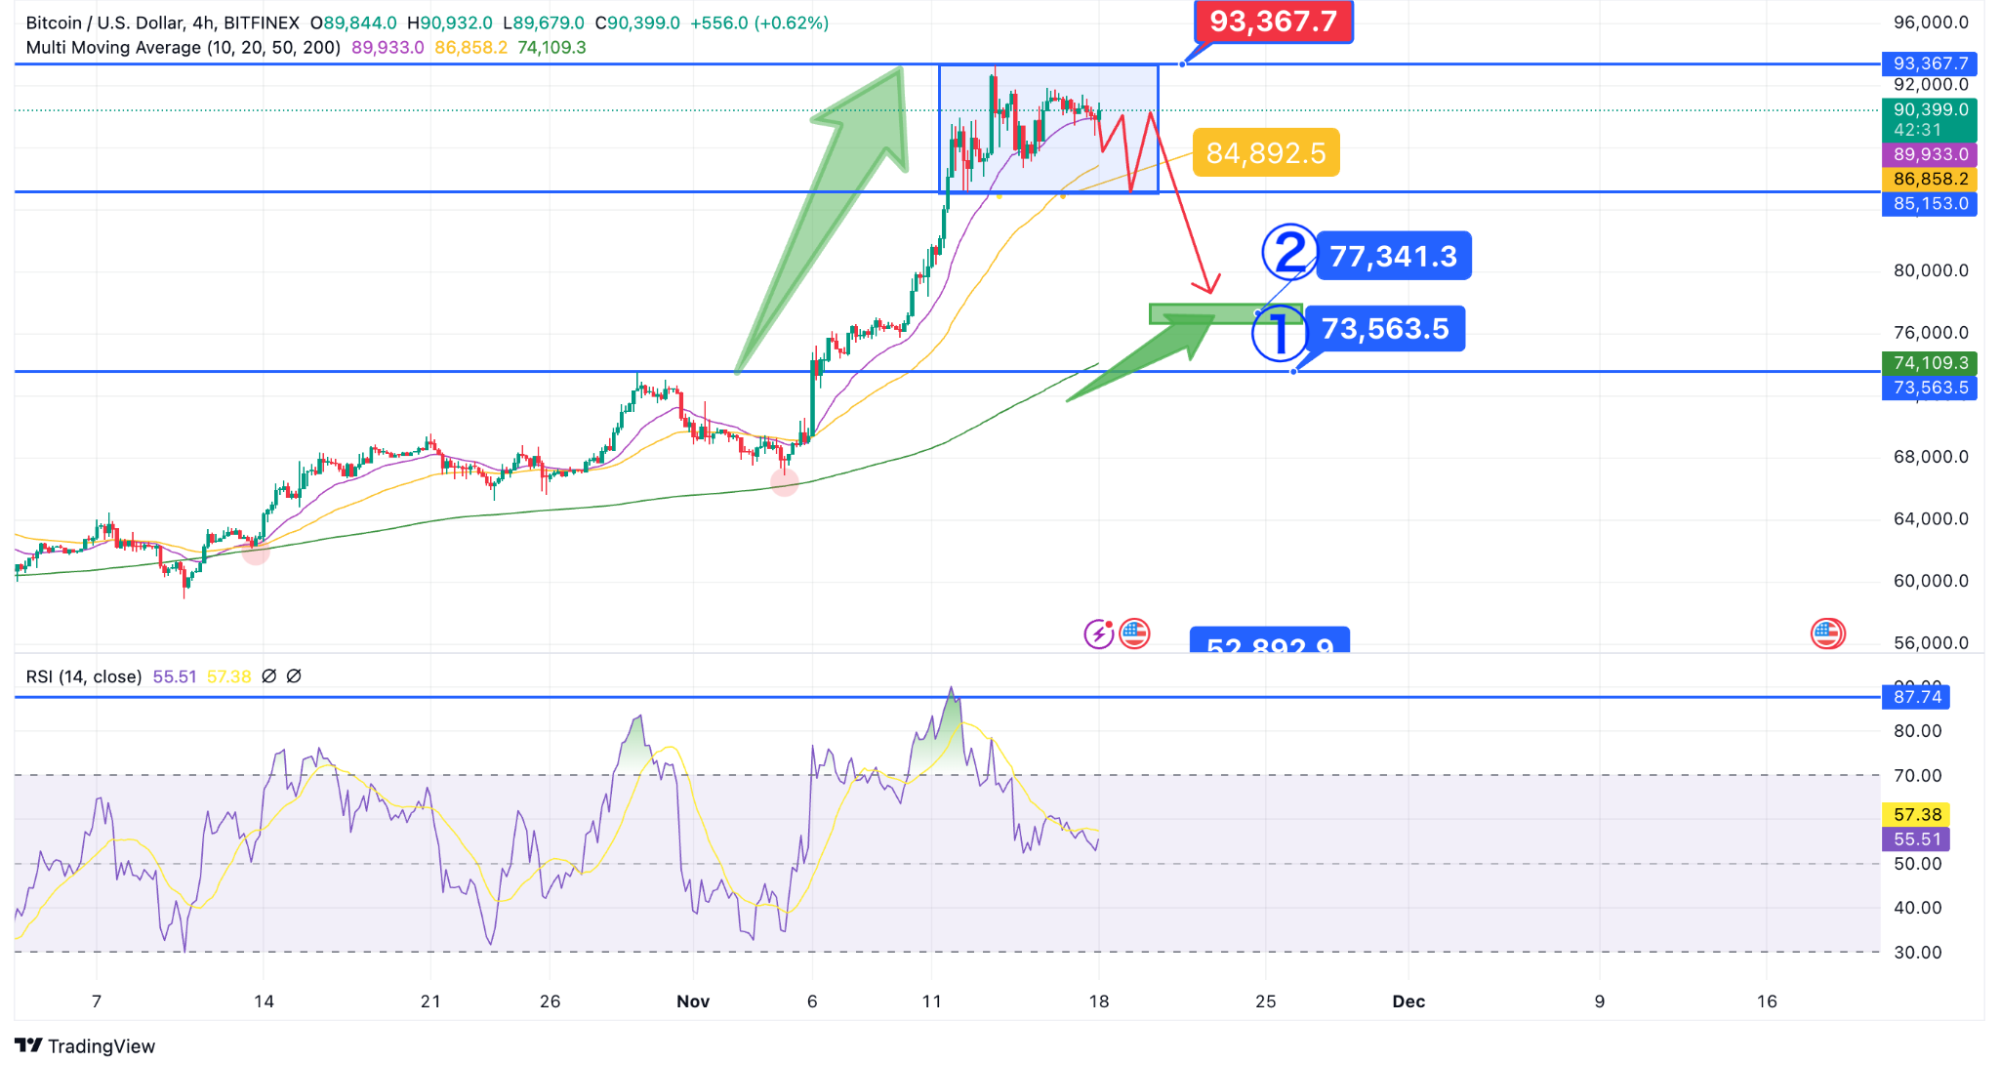
Range Dynamics: If Bitcoin breaks the lower boundary at $85,056.7, there are two key levels to watch:
- $73,563.5: This significant support level could be revisited as it previously served as a breakout point.
- $77,341.3: A support zone derived from the 200-day EMA and RSI patterns, which may offer another entry point for traders.
Considerations for Breakout Scenarios
As Bitcoin continues its price discovery phase, the potential for further upward movement or consolidation exists. Two main scenarios can unfold:
1. Bullish Scenario:
If Bitcoin maintains its position above the $85,000 mark, there is potential for it to break past the $93,367.7 resistance and approach the $100,000 mark. Institutional support and bullish market sentiment, driven by the ongoing political developments, could fuel further upward momentum. A decisive break above $93,367.7 would signal an extended rally.
2. Bearish Scenario:
If Bitcoin fails to hold above the $85,056.7 level and sees a break below that boundary, we could see a correction toward the $73,563.5 support level. In this case, short-term consolidation could occur, and Bitcoin may test lower levels before any further upward movement.
Conclusion
Bitcoin’s price action over the past week has confirmed our earlier analysis, with the cryptocurrency breaking through resistance levels and hitting an all-time high of $93,367.7. While the market is currently in a short-term consolidation phase, the broader outlook remains bullish, driven by both technical momentum and positive political developments.
As we look forward to the rest of November, Bitcoin’s ability to sustain its current price levels will depend on broader market conditions, institutional support, and the ongoing regulatory landscape. Traders should monitor key levels such as $85,056.7 and $73,563.5 closely to identify breakout or breakdown points that could influence future price movements.
As always, the cryptocurrency market remains highly volatile, and adaptability will be key for navigating these dynamic market conditions.
Beginner Friendly Glossary
- Moving Average
An indicator that helps traders in smoothing out price fluctuations and determining the actual trend. The basic idea behind the moving average is to take the average price for an X amount of periods of an asset.
Learn more here - RSI (Relative Strength Index)
An indicator derived from the price momentum of any particular asset. The main factors for the computation of the RSI are the asset’s change in price and the speed with which it happens.
Learn more here - EMA
Exponential Moving Average (EMA) is a type of moving average (MA) that gives greater importance to the recent price data. Therefore, it is preferred by traders who are looking for recent price changes of an asset.
Learn more here - Breakout
A breakout refers to when the price of an asset moves above a resistance area, or moves below a support area. Breakouts indicate the potential for the price to start trending in the breakout direction.
Learn more here - Trading Ranges
Ranges in crypto trading refer to the fluctuation of a cryptocurrency’s price within a specific high and low boundary. Understanding and utilizing ranges can help traders identify potential entry and exit points for their trades.
Learn more here
DISCLAIMER: THE CONTENT PROVIDED IN THIS ARTICLE IS FOR INFORMATIONAL PURPOSES ONLY AND SHOULD NOT BE CONSIDERED FINANCIAL, LEGAL, OR INVESTMENT ADVICE. CRYPTOCURRENCY INVESTMENTS CARRY A HIGH DEGREE OF RISK AND MAY NOT BE SUITABLE FOR EVERY INVESTOR. PAST PERFORMANCE DOES NOT GUARANTEE FUTURE RESULTS. THIS ANALYSIS IS INTENDED PURELY AS AN OBSERVATION OF SPECIFIC PRICE LEVELS AND TRENDS TO AID IN UNDERSTANDING POTENTIAL MARKET DIRECTIONS. YOU ARE ENCOURAGED TO DO YOUR OWN RESEARCH AND CONSULT WITH A LICENSED PROFESSIONAL BEFORE MAKING ANY FINANCIAL DECISIONS. THE INFORMATION HEREIN IS CURRENT AS OF THE PUBLICATION DATE AND MAY CHANGE WITHOUT NOTICE.