KEY INSIGHTS
Approaching Adjustment? Spotlight on BTC’s Final Price Push: Bitcoin has reached a peak of $106,503, but momentum is slowing, suggesting a potential shift toward a correction phase.
104,012.4 Revisited: The Key to New Support Levels: The $104,012.4 support line is being tested again. Whether the price bounces back or breaks through will determine the next trend.
Short-Term Trend Supported by the 200-Day Moving Average: In the short term, the 200-day moving average is functioning as a support line. As long as this level holds, further rebounds remain possible.
Volatility and Psychological Thresholds: Amid high volatility, price movements around the psychological threshold of $100,000 are significantly influencing market sentiment.
Introduction
Reflections on the Previous Analysis
In the last week’s article (9 Dec 2024), Bitcoin’s (BTC) breach of the $100,000 milestone raised expectations of a continued bullish trend. However, the resistance levels at $104,012.4 and $101,919.5 emerged as critical barriers to further upward momentum.
Subsequent price adjustments were followed by another rally, highlighting a high-volatility environment. Attention now turns to whether these resistance lines can turn into support and how the market responds to the broader long-term trend.
Price Review & Summary of Last Week’s Analysis
The previous analysis identified $104,012.4 and $101,919.5 as significant resistance levels that constrained Bitcoin’s price movements. Although Bitcoin temporarily dipped below $100,000, it rebounded to reach a new high of $106,503.
The focus now shifts to whether these price zones continue to play a pivotal role or if new support levels emerge. Flexible strategies, considering short-term moving averages and changes in market sentiment, will be essential.
Market Analysis & Price Action

Significant Price Movement Analysis
Bitcoin has reached a high of $106,503, showing resilience with a notable rebound. However, a temporary dip below the psychological $100,000 level signaled a correction phase. The key support levels at $104,012.4 and $101,919.5 remain in focus as their functionality as support lines or potential breakdown points could dictate the next trend.
Detailed Analysis
Daily Chart: Overall Movements

The gradual upward trend continues, keeping the psychological target of $107,000 (as noted in the previous report) in sight.
However, the heightened volatility and uncertainty surrounding the sustained bullish momentum necessitate a cautious perspective. The support levels at $104,012.4 and $101,919.5 remain pivotal.
4-Hour Chart: Key Price Levels
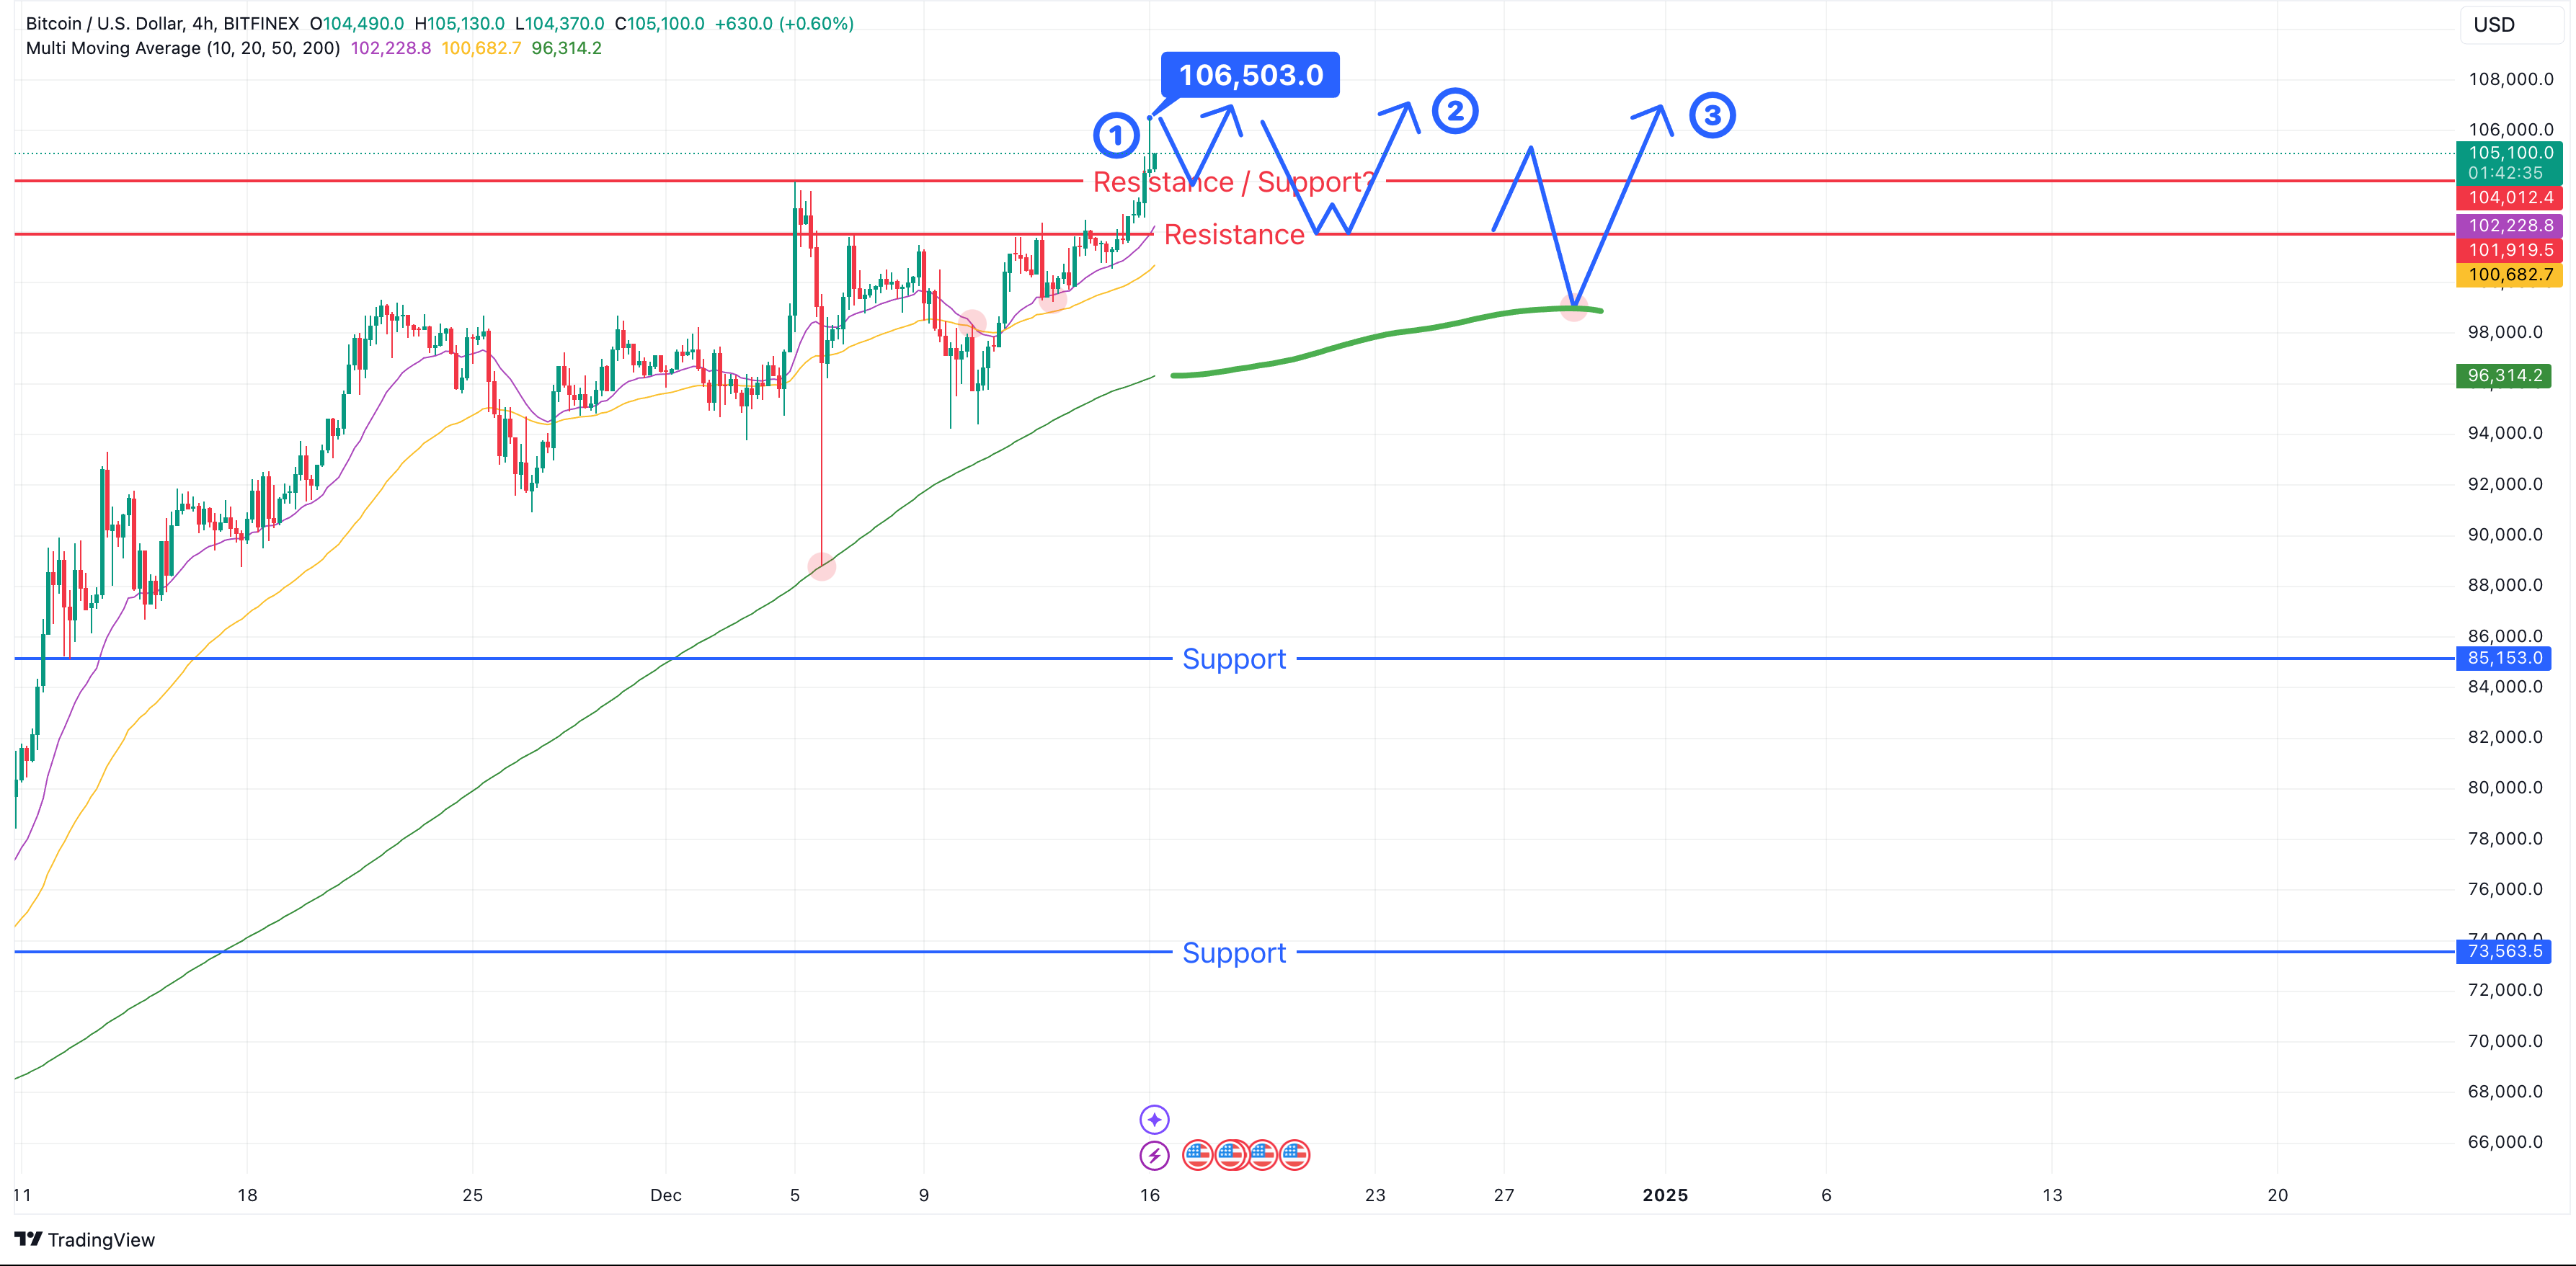
After setting a new high, Bitcoin faced selling pressure that led to a brief adjustment. Whether the $104,012.4 and $101,919.5 levels act as rebound points is key. Movements at these levels are likely to shape the short-term trend direction.
1-Hour Chart: Key Price Levels
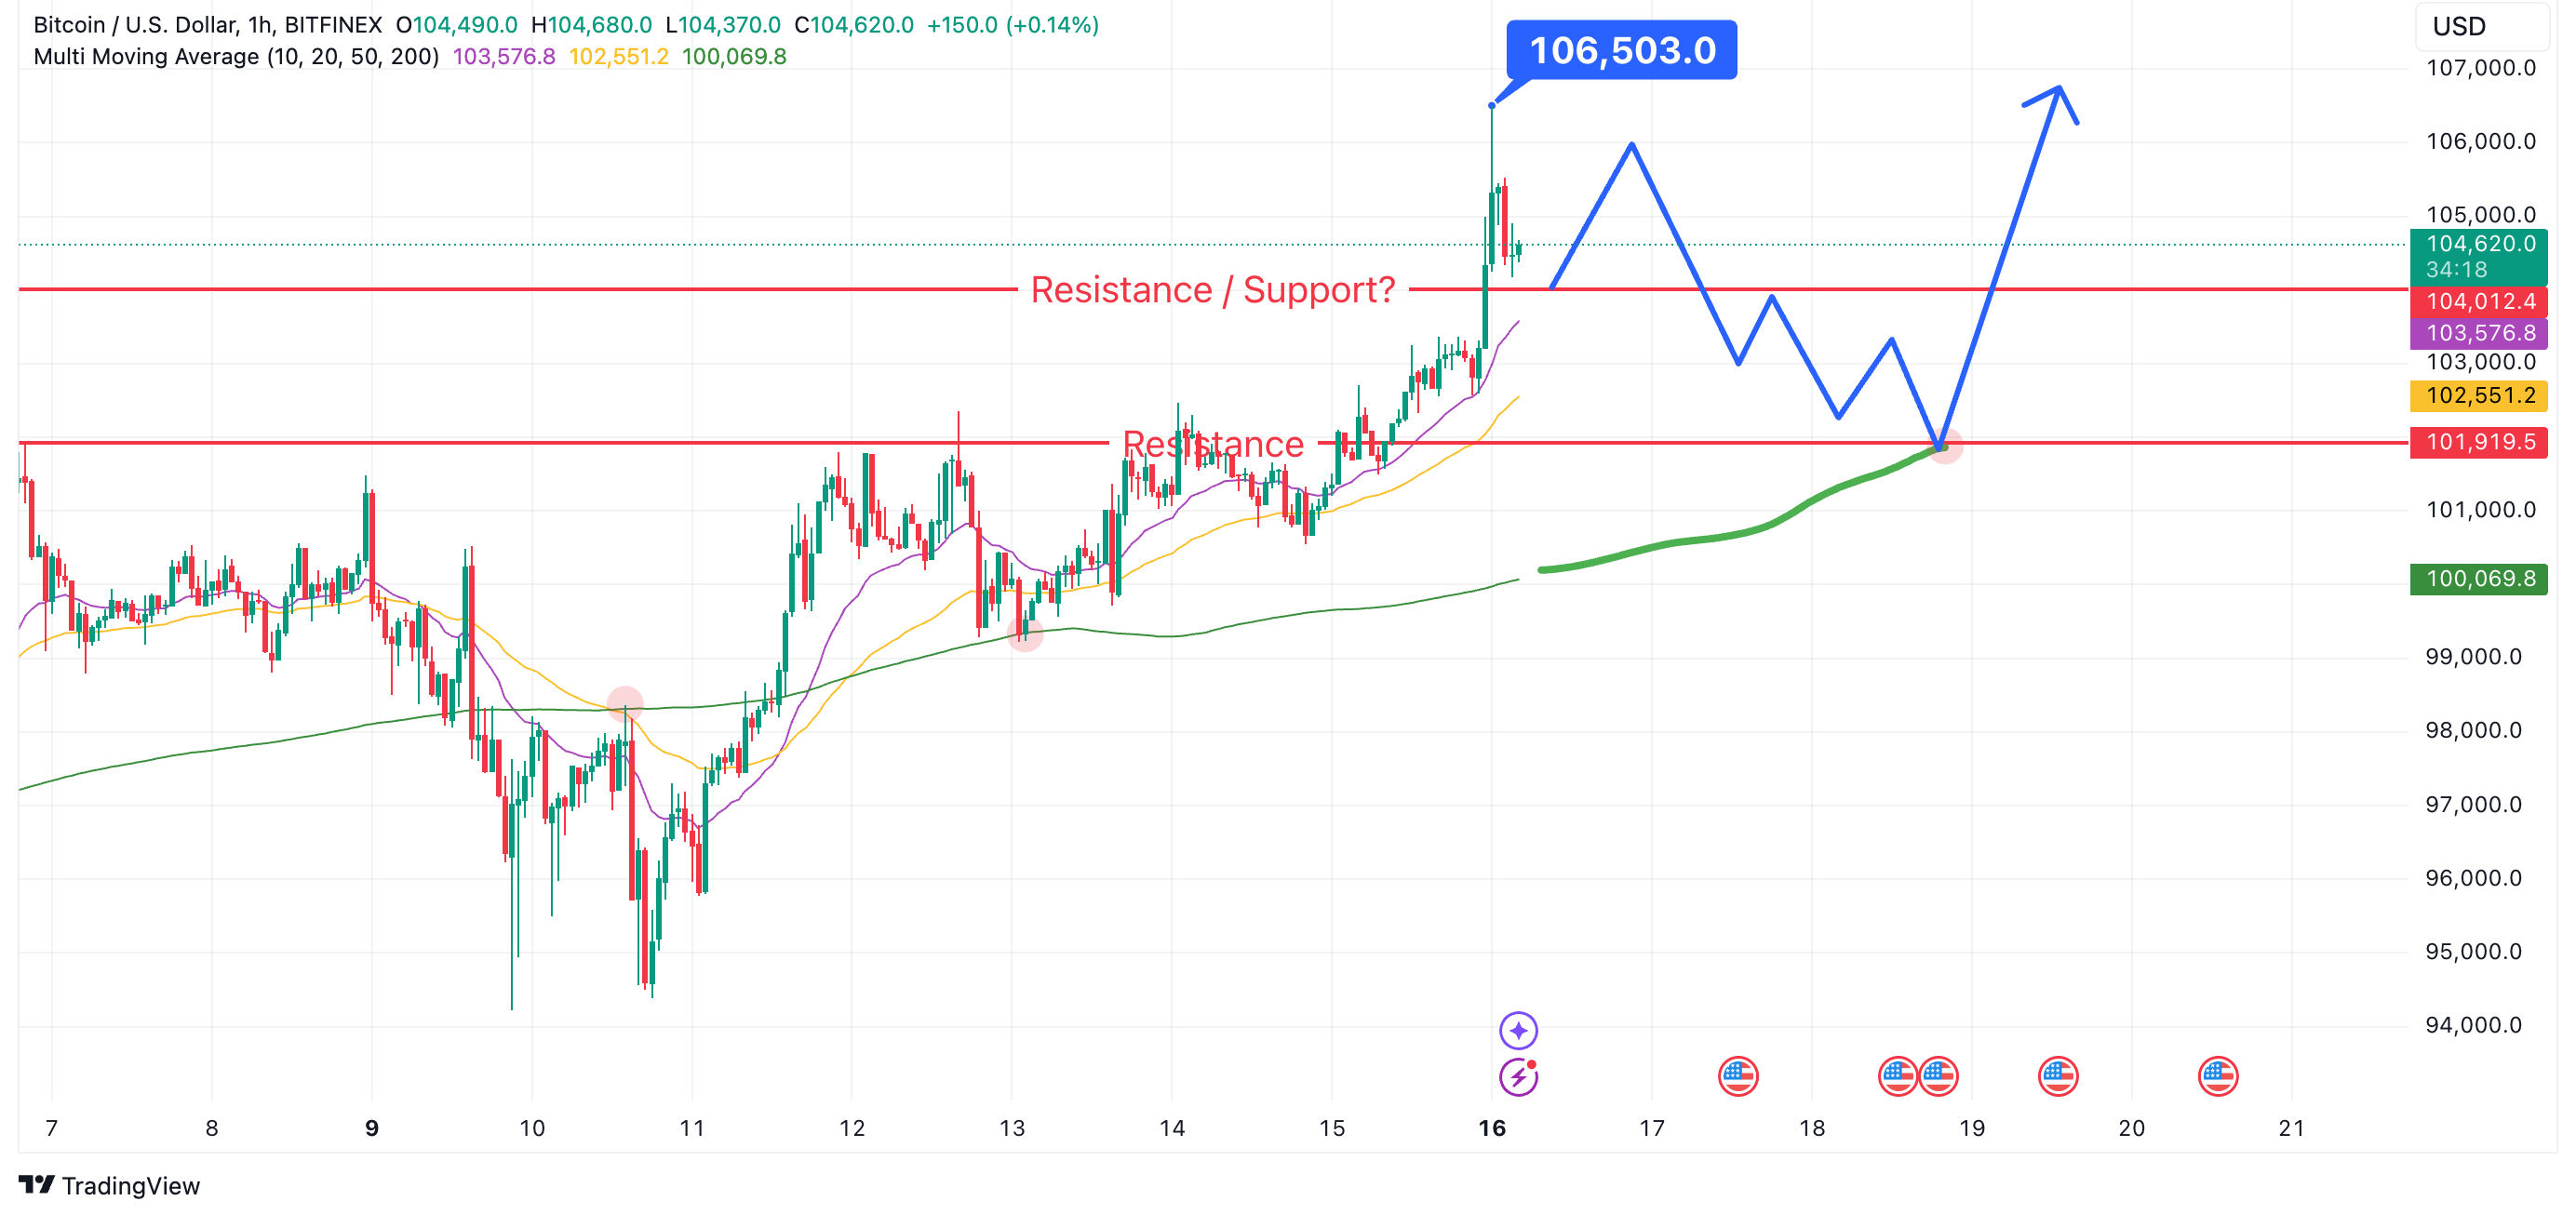
In the short term, Bitcoin’s price is supported by the 200-day moving average. Monitoring the movements around $104,012.4 and $101,919.5 is crucial. If these levels fail, the psychological $100,000 threshold may emerge as the next potential support zone.
Conclusion
Bitcoin has demonstrated resilience by climbing to a new high of $106,503 after temporarily dipping below $100,000. The critical support levels at $104,012.4 and $101,919.5 remain key indicators for the short-term trend. The market’s ability to maintain these levels as support or establish new ones will shape future movements. Investors should monitor these levels closely while adapting their strategies to align with emerging price dynamics.
Beginner Friendly Glossary
- Support Line
Support line is a stock market term used to describe the point after which the stock price does not fall. It acts as a support for the price to rise upward after a downward trend.
Learn more here - Resistance Line
Resistance is a price or price zone above the current market that contains the upside movement of an asset. Resistance is where selling interest appears over time, blocking further upside progress.
Learn more here - Moving Averages (200-day Moving Average)
The 200 Day Moving Average is a long term moving average that helps determine the overall health of a stock. A 200 Day moving average is calculated by taking the closing prices for the last 200 days of any security, summing them together and dividing by 200.
Learn more here - Bullish
The term “Bullish” refers to a positive sentiment for a particular investment or the general market. This refers to a general expectation that the investment or market will grow.
Learn more here - Selling Pressure
Selling Pressure occurs when the majority of the traders are selling, indicating that the majority think the market price will decrease.
Learn more here - Role Reversal
A support and resistance role reversal is when support becomes resistance or vice versa because these levels are broken. When the price breaks through a support or resistance level and then goes back to its original range it’s called a reversal.
Learn more here
DISCLAIMER: THE CONTENT PROVIDED IN THIS ARTICLE IS FOR INFORMATIONAL PURPOSES ONLY AND SHOULD NOT BE CONSIDERED FINANCIAL, LEGAL, OR INVESTMENT ADVICE. CRYPTOCURRENCY INVESTMENTS CARRY A HIGH DEGREE OF RISK AND MAY NOT BE SUITABLE FOR EVERY INVESTOR. PAST PERFORMANCE DOES NOT GUARANTEE FUTURE RESULTS. THIS ANALYSIS IS INTENDED PURELY AS AN OBSERVATION OF SPECIFIC PRICE LEVELS AND TRENDS TO AID IN UNDERSTANDING POTENTIAL MARKET DIRECTIONS. YOU ARE ENCOURAGED TO DO YOUR OWN RESEARCH AND CONSULT WITH A LICENSED PROFESSIONAL BEFORE MAKING ANY FINANCIAL DECISIONS. THE INFORMATION HEREIN IS CURRENT AS OF THE PUBLICATION DATE AND MAY CHANGE WITHOUT NOTICE.