KEY INSIGHTS
- Neutral trend persists across daily, 4-hour, and 1-hour timeframes for BTC/USD.
- Support and resistance levels remain at $96,241.4 and $91,677.6, respectively.
- Mixed technical indicators suggest potential for both upward and downward movements.
Introduction
Review of the Previous Week:
Last week, Bitcoin’s price dropped to $94,300 (-2.6%), driven by rising U.S. bond yields and a stronger dollar. This highlights how broader economic factors are influencing the crypto market. Additionally, Bitcoin’s price mirrored U.S. stock trends, reflecting a strong connection between the two markets and increasing sensitivity to global financial changes.
Market Changes Since Last Week:
Since last week, the BTC/USD pair has stayed mostly unchanged. However, the overall cryptocurrency market is becoming more active, especially with altcoins. Experts, like those at Presto Research, believe 2025 could be a big year for altcoins, with major growth expected thanks to more companies getting involved and new technologies being developed. They even predict the crypto market could reach a total value of $7.5 trillion.
Detailed Analysis
Daily Chart: Key Price Levels
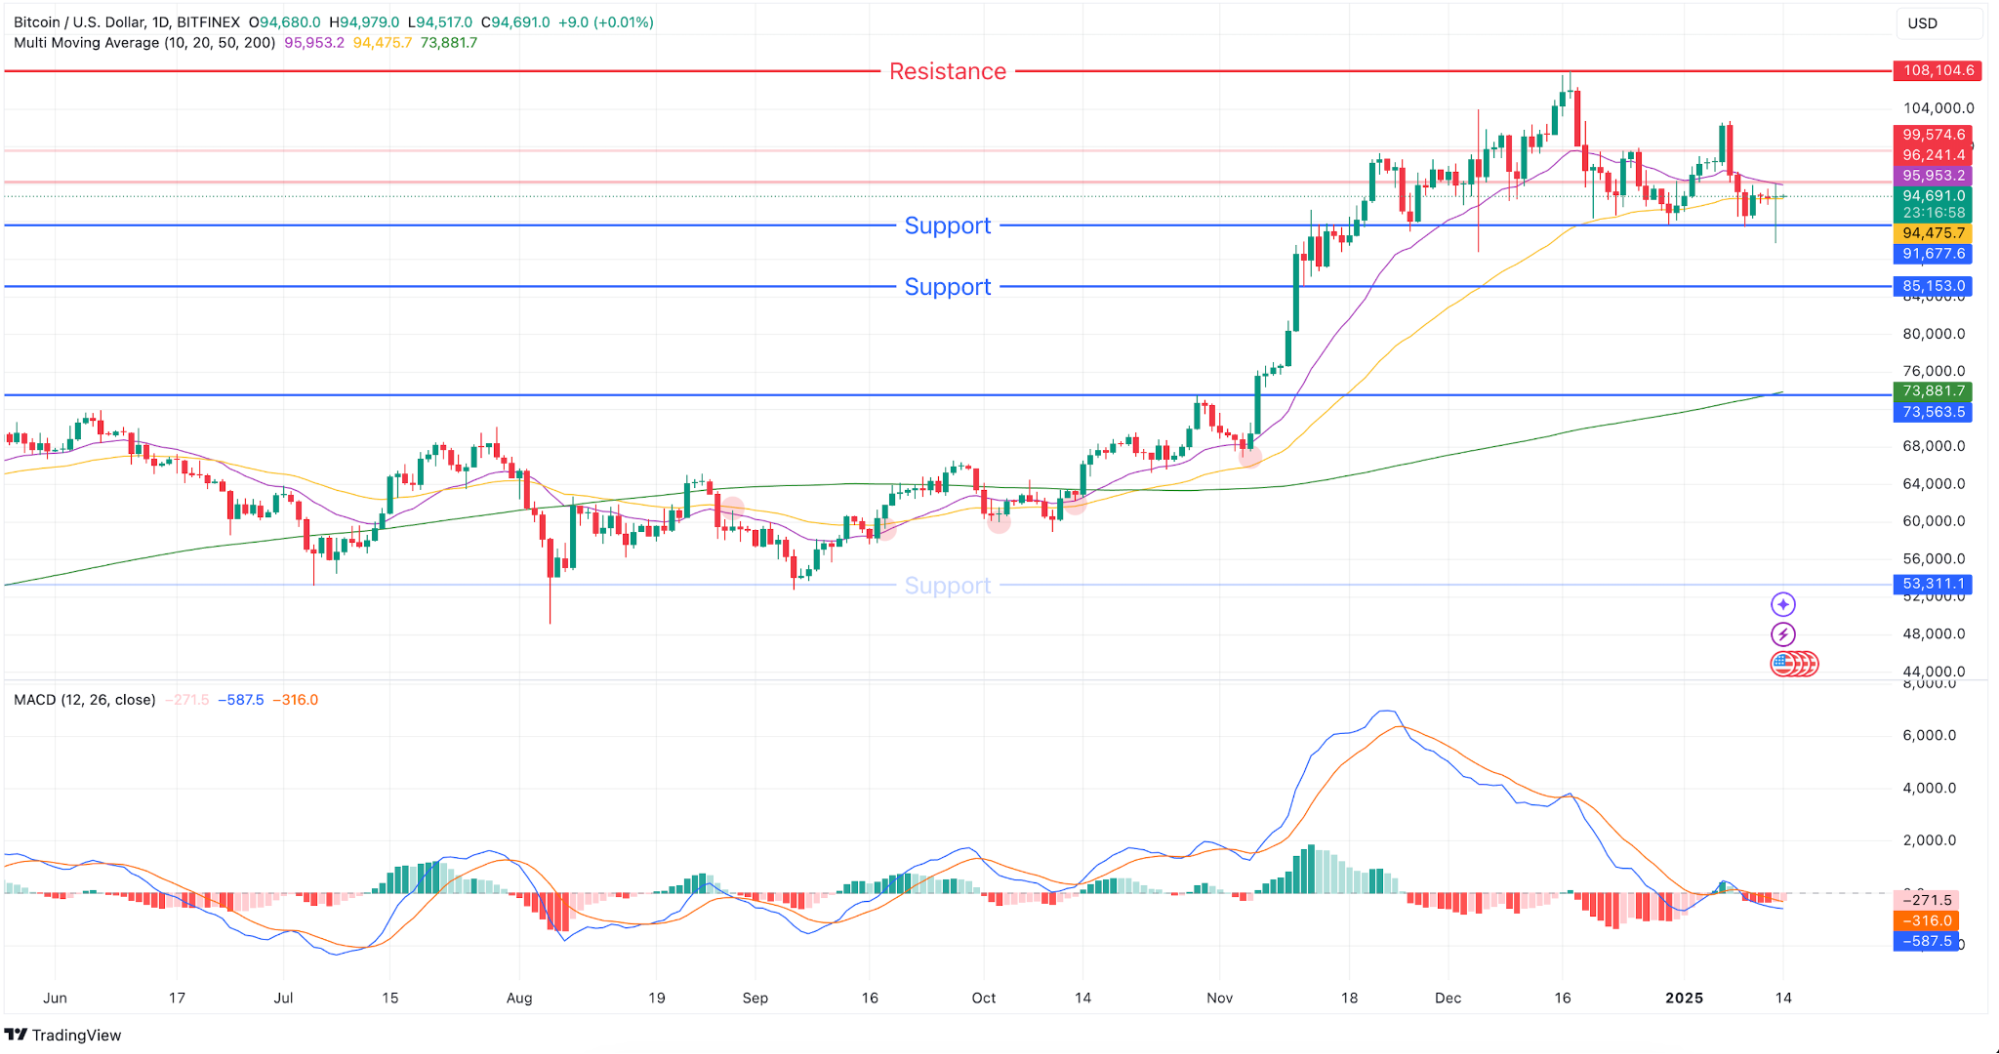
- Trend: Neutral
- Support Level: $91,677.6
- Resistance Level: $96,241.4
- MACD: Bearish momentum with a negative histogram and a Death Cross signaling a downtrend
- Moving Averages: Price is slightly above the 50-day MA, acting as resistance, and far above the 200-day MA, providing strong support
The daily chart reflects a neutral trend with bearish indicators. The Death Cross and negative MACD histogram suggest caution, though the price remains between key Support and Resistance Level.
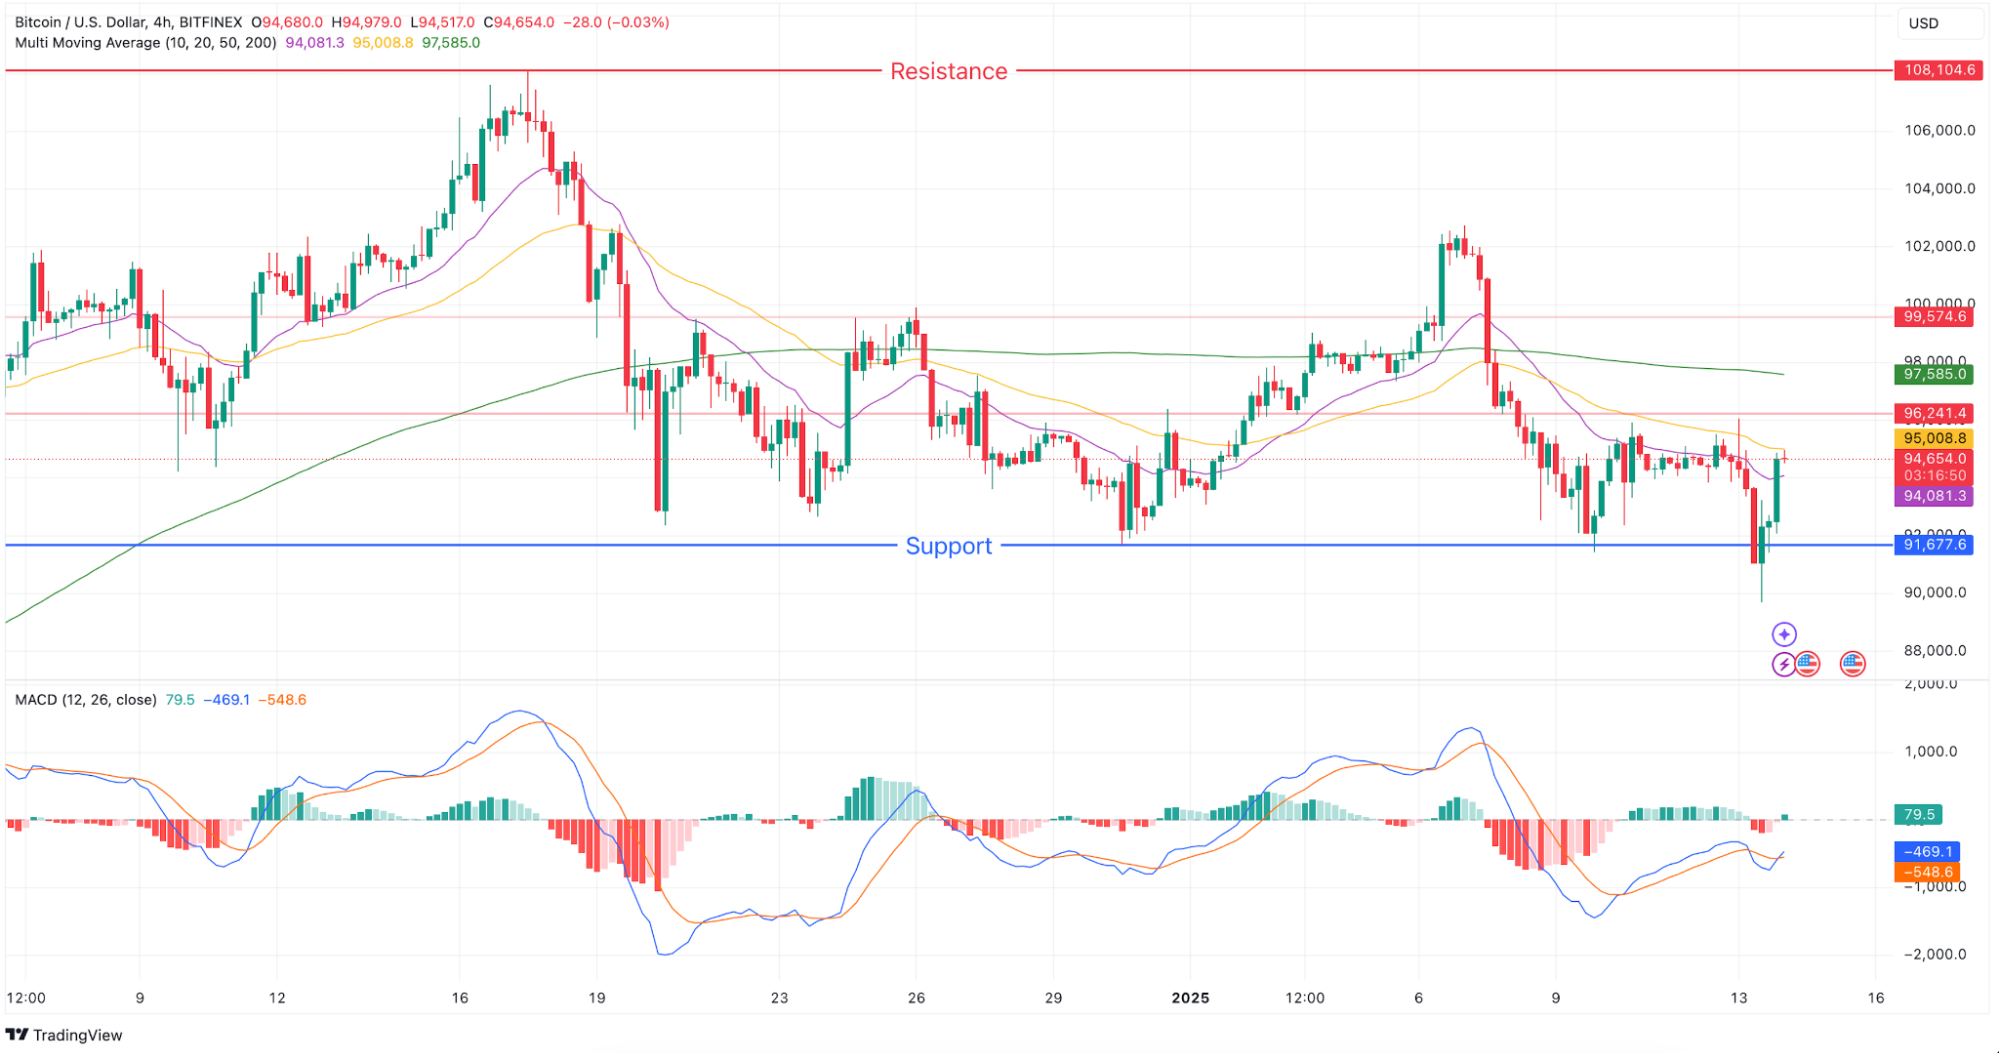
- Trend: Neutral
- Support Level: $91,677.6
- Resistance Level: $96,241.4
- MACD: Mixed signals with a positive histogram but overall indecision.
- Moving Averages: Price is below both the 50-period and 200-period MAs.(At the time of analysis)
Summary
The 4-hour timeframe shows a neutral trend with mixed signals. Positive MACD histogram hints at potential upward movement, but the presence of both crossovers indicates uncertainty.
1-Hour Chart: Key Price Levels
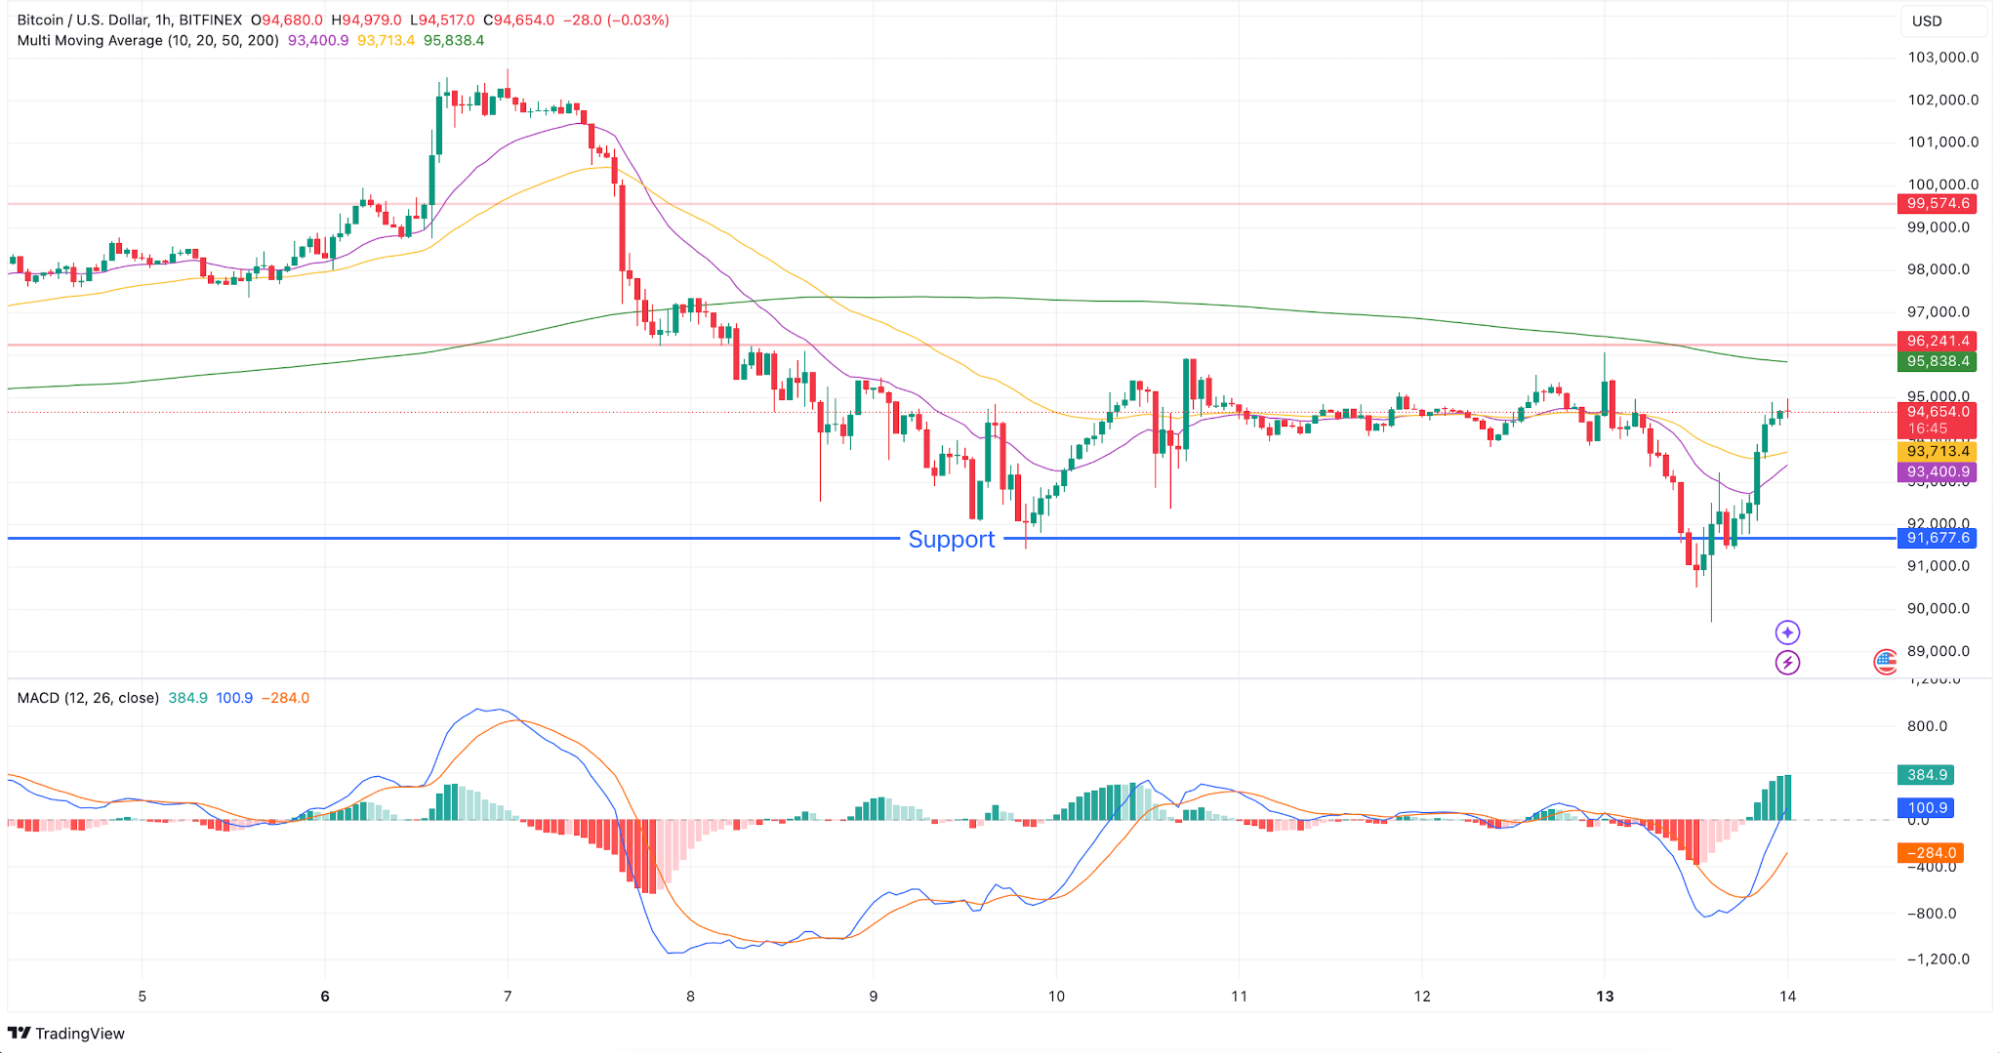
- Trend: Neutral
- Support Level: $91,677.6
- Resistance Level: $96,241.4
- MACD: Mild bullish momentum with a positive histogram, but indecision remains.
- Moving Averages: Price is above the 50-period MA (support) but below the 200-period MA (resistance).
Summary
The hourly chart shows that the price is in a neutral trend, sitting above the 50-period moving average (support at $96,241.4) but below the 200-period moving average (resistance at $91,677.6). The MACD shows slightly bullish momentum, but since the moving averages haven’t crossed (no Golden Cross or Death Cross), the market is still undecided and moving sideways.
Conclusion
BTC/USD continues to exhibit a neutral trend across all analyzed timeframes, confined within the support level of $96,241.4 and resistance at $91,677.6. Technical indicators present mixed signals, with bearish patterns on the daily chart and potential bullish divergences in shorter timeframes. Market participants should monitor these key levels and technical signals closely, as a breakout or breakdown could define the next significant price movement.
Beginner Friendly Glossary
- MACD (Moving Average Convergence Divergence): A trend-following momentum indicator that shows the relationship between two moving averages of a security’s price.
- Golden Cross: A bullish signal in which a relatively short-term moving average crosses above a long-term moving average.
- Death Cross: A bearish signal where a short-term moving average crosses below a long-term moving average.
- Support Level: A price level where a downtrend can be expected to pause due to a concentration of demand.
- Resistance Level: A price point where the rise of a stock or cryptocurrency is halted by the emergence of a growing number of sellers.
- Moving Average (MA): A stock indicator that is commonly used in technical analysis; it helps smooth out price data by creating a constantly updated average price.
DISCLAIMER: THE CONTENT PROVIDED IN THIS ARTICLE IS FOR INFORMATIONAL PURPOSES ONLY AND SHOULD NOT BE CONSIDERED FINANCIAL, LEGAL, OR INVESTMENT ADVICE. CRYPTOCURRENCY INVESTMENTS CARRY A HIGH DEGREE OF RISK AND MAY NOT BE SUITABLE FOR EVERY INVESTOR. PAST PERFORMANCE DOES NOT GUARANTEE FUTURE RESULTS. THIS ANALYSIS IS INTENDED PURELY AS AN OBSERVATION OF SPECIFIC PRICE LEVELS AND TRENDS TO AID IN UNDERSTANDING POTENTIAL MARKET DIRECTIONS. YOU ARE ENCOURAGED TO DO YOUR OWN RESEARCH AND CONSULT WITH A LICENSED PROFESSIONAL BEFORE MAKING ANY FINANCIAL DECISIONS. THE INFORMATION HEREIN IS CURRENT AS OF THE PUBLICATION DATE AND MAY CHANGE WITHOUT NOTICE.