KEY INSIGHTS
- The current Bitcoin price has broken above the $52,689.8 – $73,563.5 range and appears to be turning higher.
- RSI had recorded 86.74 as the maximum value in the past when it broke above the 70 lines and has since turned sideways after a temporary decline.
- This section examines the potential for future price fluctuations.
Introduction
As of November 11, 2024, Bitcoin has experienced a significant uptrend, reaching an all-time high of $81,722.677 (when this article was written). This surge is largely attributed to the approval and rapid growth of BlackRock’s iShares Bitcoin Trust (IBIT), now surpassing its gold ETF counterpart. Increased institutional interest, combined with the recent election of Donald Trump—who advocates for a pro-crypto stance in regulatory policies—has intensified optimism about Crypto’s future.
With speculation mounting about a potential $100,000 Bitcoin rally, let’s dive into the technicals to understand where Bitcoin’s price might be headed next. Read on for our in-depth analysis.
Source: TradingView.com
Stock covered: BTC/USD (Bitfinex)
Analysis Period: July 2023 to present
Technical Indicators Used: Horizontal Lines / Multiple Moving Averages / RSI.
Prediction of future high prices focusing on RSI
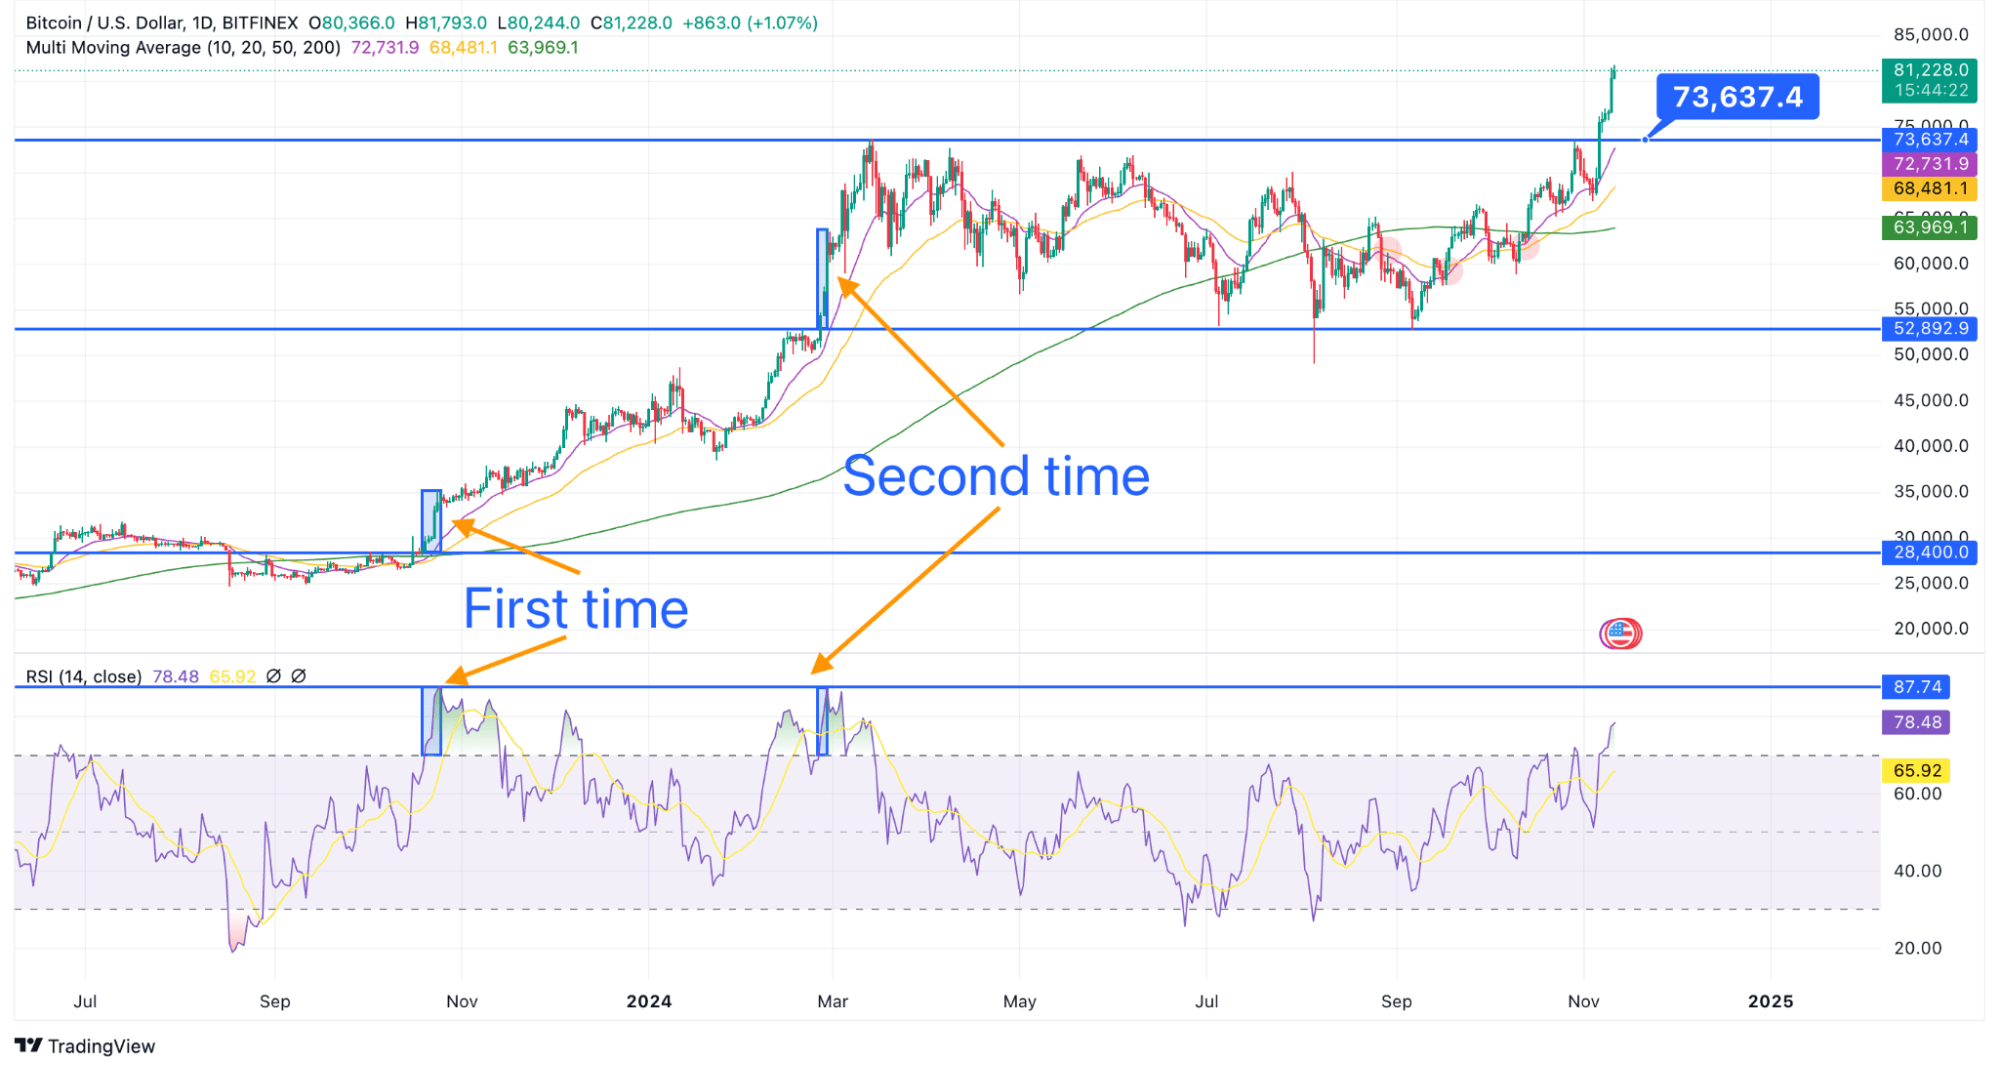
In the past, when the price broke above 70 points, the RSI reached its highest point of 87.79 twice. Assuming that a similar pattern will form in the current case and that 87.79 will be reached, the following upside potential can be confirmed.
- First time: Price climb $7,130.2 after breaking the horizon line
- Second time: Price climb $11,107.6 after breaking the horizon line
- Starting price of current horizon line break: $73,563.5
- Could this indicate potential to reach at least $84,671.1?
Based on this information, the following three perspectives are considered.
Daily Level Analysis
- There is a minor uptrend and a possible return to the breakpoint.
- After this horizontal break, if the RSI does not go below 70, a move similar to the second breakpoint of the RSI is assumed and the price may rise toward $84,671.1 with RSI reaching 87.79.
- Following the trend, selling pressure will increase and the price may fall back to $73,563.5.
4-hourly Level Analysis
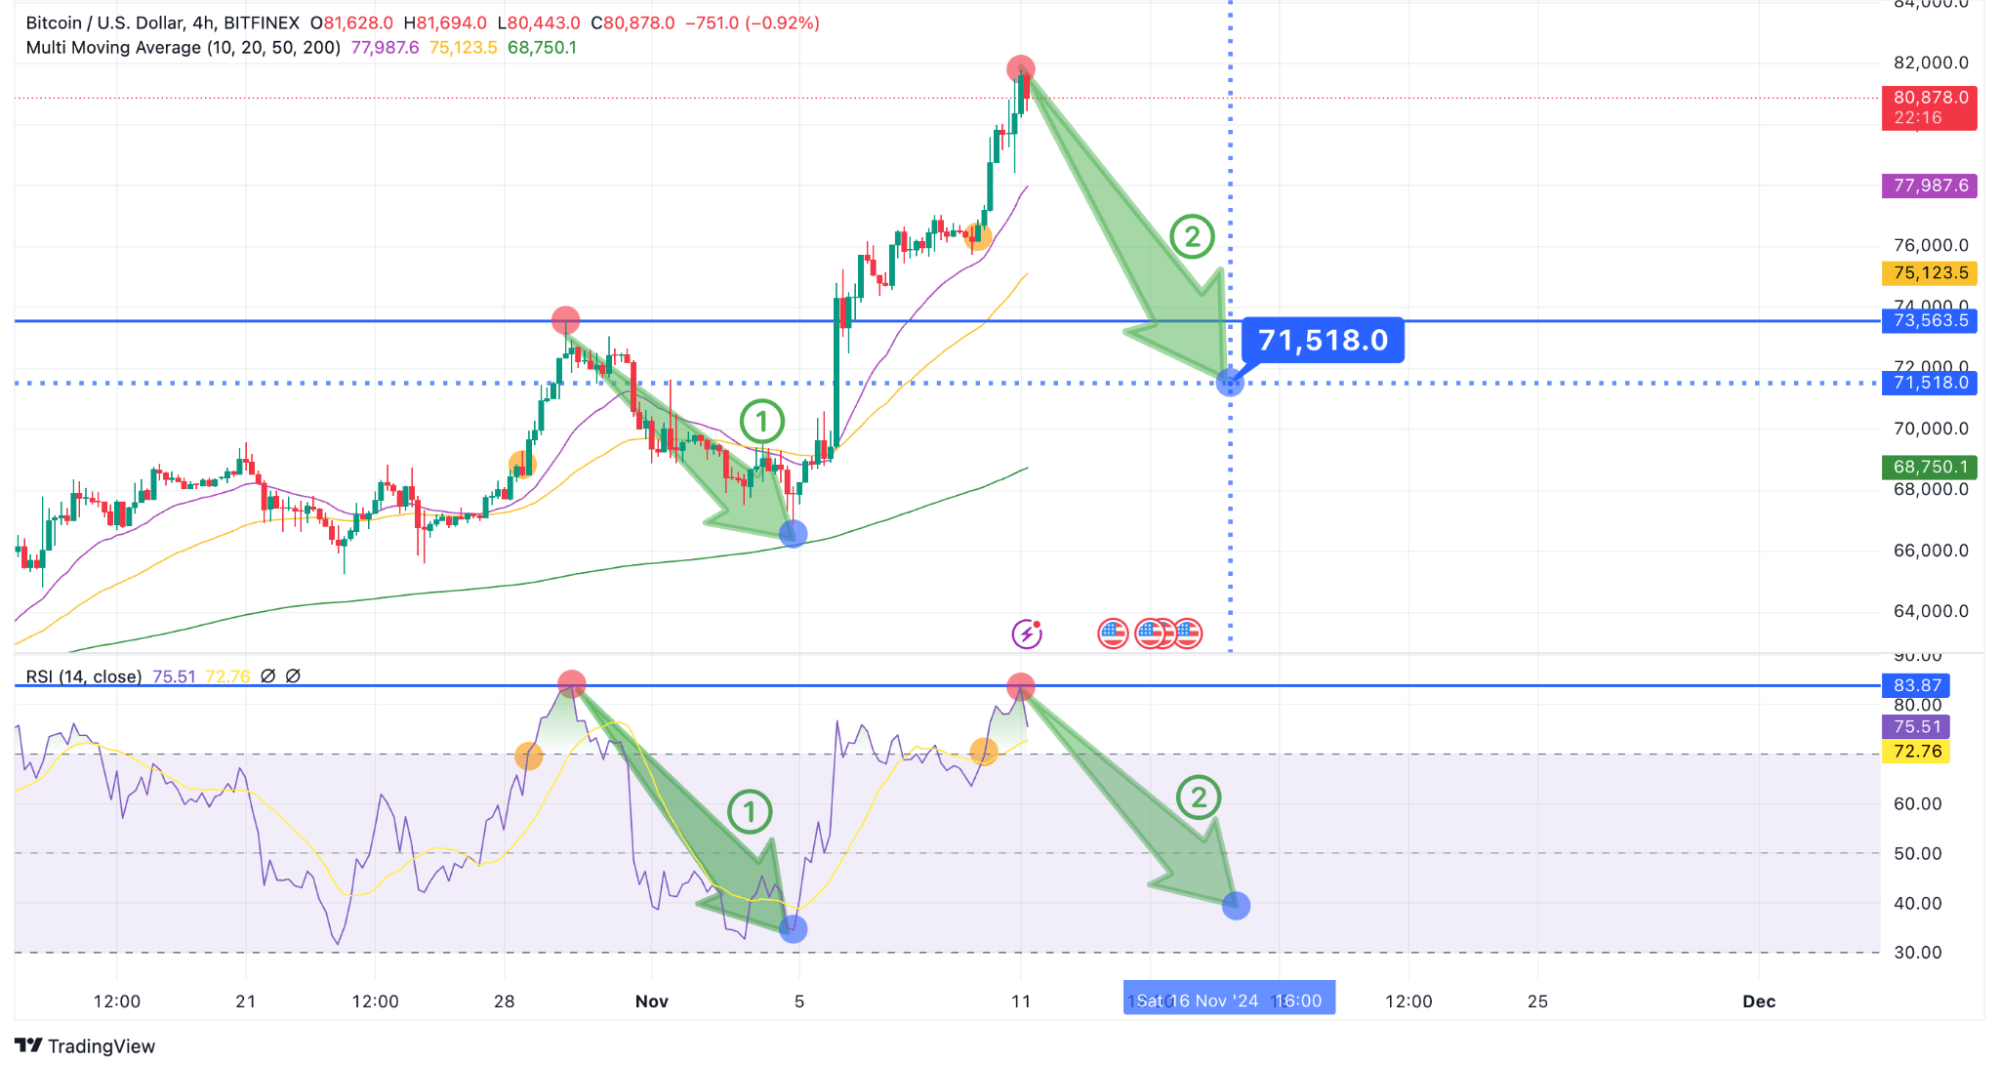
- The 200-day moving average (green line) appears to be functioning and a rebound is likely.
- The RSI has reached its recent high, suggesting a downtrend.
- Previously, after the RSI reached the red circle in trend ①, a review of the main chart shows that the price has approached the vicinity of the 200-day moving average.
- Based on trend ① RSI patterns, there is a possibility that the price may again move close to the 200-day moving average in the near future (shown as trend ②). When that happens, the BTC price can be expected to drop to $71,518.
Scenarios for Future Price Trends
Scenario 1: Monitoring the trend may be informative based on the initial trend break level of $73,563.5.
Scenario 2: Buy order activity could potentially increase around $71,518, aligning with the recent RSI movement below 70 and the anticipated intersection near the low 30s with the 200-day moving average.
Accordingly, by considering the trend break levels at $73,563.5 or $71,518, observing any continued uptrend in the price movement may provide useful insights.
Beginner Friendly Glossary
- Horizontal Line
Used in technical analysis to mark areas of support or resistance. A horizontal line runs parallel to the x-axis.
Learn more here
- Moving Average
An indicator that helps traders in smoothing out price fluctuations and determining the actual trend. The basic idea behind the moving average is to take the average price for an X amount of periods of an asset.
Learn more here
- RSI (Relative Strength Index)
An indicator derived from the price momentum of any particular asset. The main factors for the computation of the RSI are the asset’s change in price and the speed with which it happens.
Learn more here - Timeframe
A time frame refers to the amount of time that a trend lasts for in a market, which can be identified and used by traders. These time frames can range from minutes or hours to days or weeks, or even longer.
Learn more here
DISCLAIMER: THE CONTENT PROVIDED IN THIS ARTICLE IS FOR INFORMATIONAL PURPOSES ONLY AND SHOULD NOT BE CONSIDERED FINANCIAL, LEGAL, OR INVESTMENT ADVICE. CRYPTOCURRENCY INVESTMENTS CARRY A HIGH DEGREE OF RISK AND MAY NOT BE SUITABLE FOR EVERY INVESTOR. PAST PERFORMANCE DOES NOT GUARANTEE FUTURE RESULTS. THIS ANALYSIS IS INTENDED PURELY AS AN OBSERVATION OF SPECIFIC PRICE LEVELS AND TRENDS TO AID IN UNDERSTANDING POTENTIAL MARKET DIRECTIONS. YOU ARE ENCOURAGED TO DO YOUR OWN RESEARCH AND CONSULT WITH A LICENSED PROFESSIONAL BEFORE MAKING ANY FINANCIAL DECISIONS. THE INFORMATION HEREIN IS CURRENT AS OF THE PUBLICATION DATE AND MAY CHANGE WITHOUT NOTICE.