KEY INSIGHTS
- The weekly MACD formed a dead cross, signaling potential bearish momentum.
- BTC/USD trades below the 50MA across timeframes, indicating short-term downward pressure.
- Strong resistance at $108,104.6 with critical support at $91,664.9 and $73,563.5.
Introduction
Review of the Previous Week:
Bitcoin moved within a tight $6,000 range last week, reflecting low volatility. The weekly MACD formed a bearish crossover, hinting at a possible long-term trend reversal and weakening bullish momentum. Support and resistance levels remain crucial to watch.
Market Changes Since Last Week:
On February 3rd, speculation about sovereign wealth funds adopting Bitcoin sparked a brief rally, but prices stayed between $96,000 and $99,000. On February 7th, BlackRock increased its MicroStrategy stake by 0.91% to 5%, signaling strong institutional confidence. These events highlight the impact of government and institutional moves on Bitcoin’s price. Let’s move to the technical analysis.
Detailed Analysis
Weekly Chart: Key Price Levels
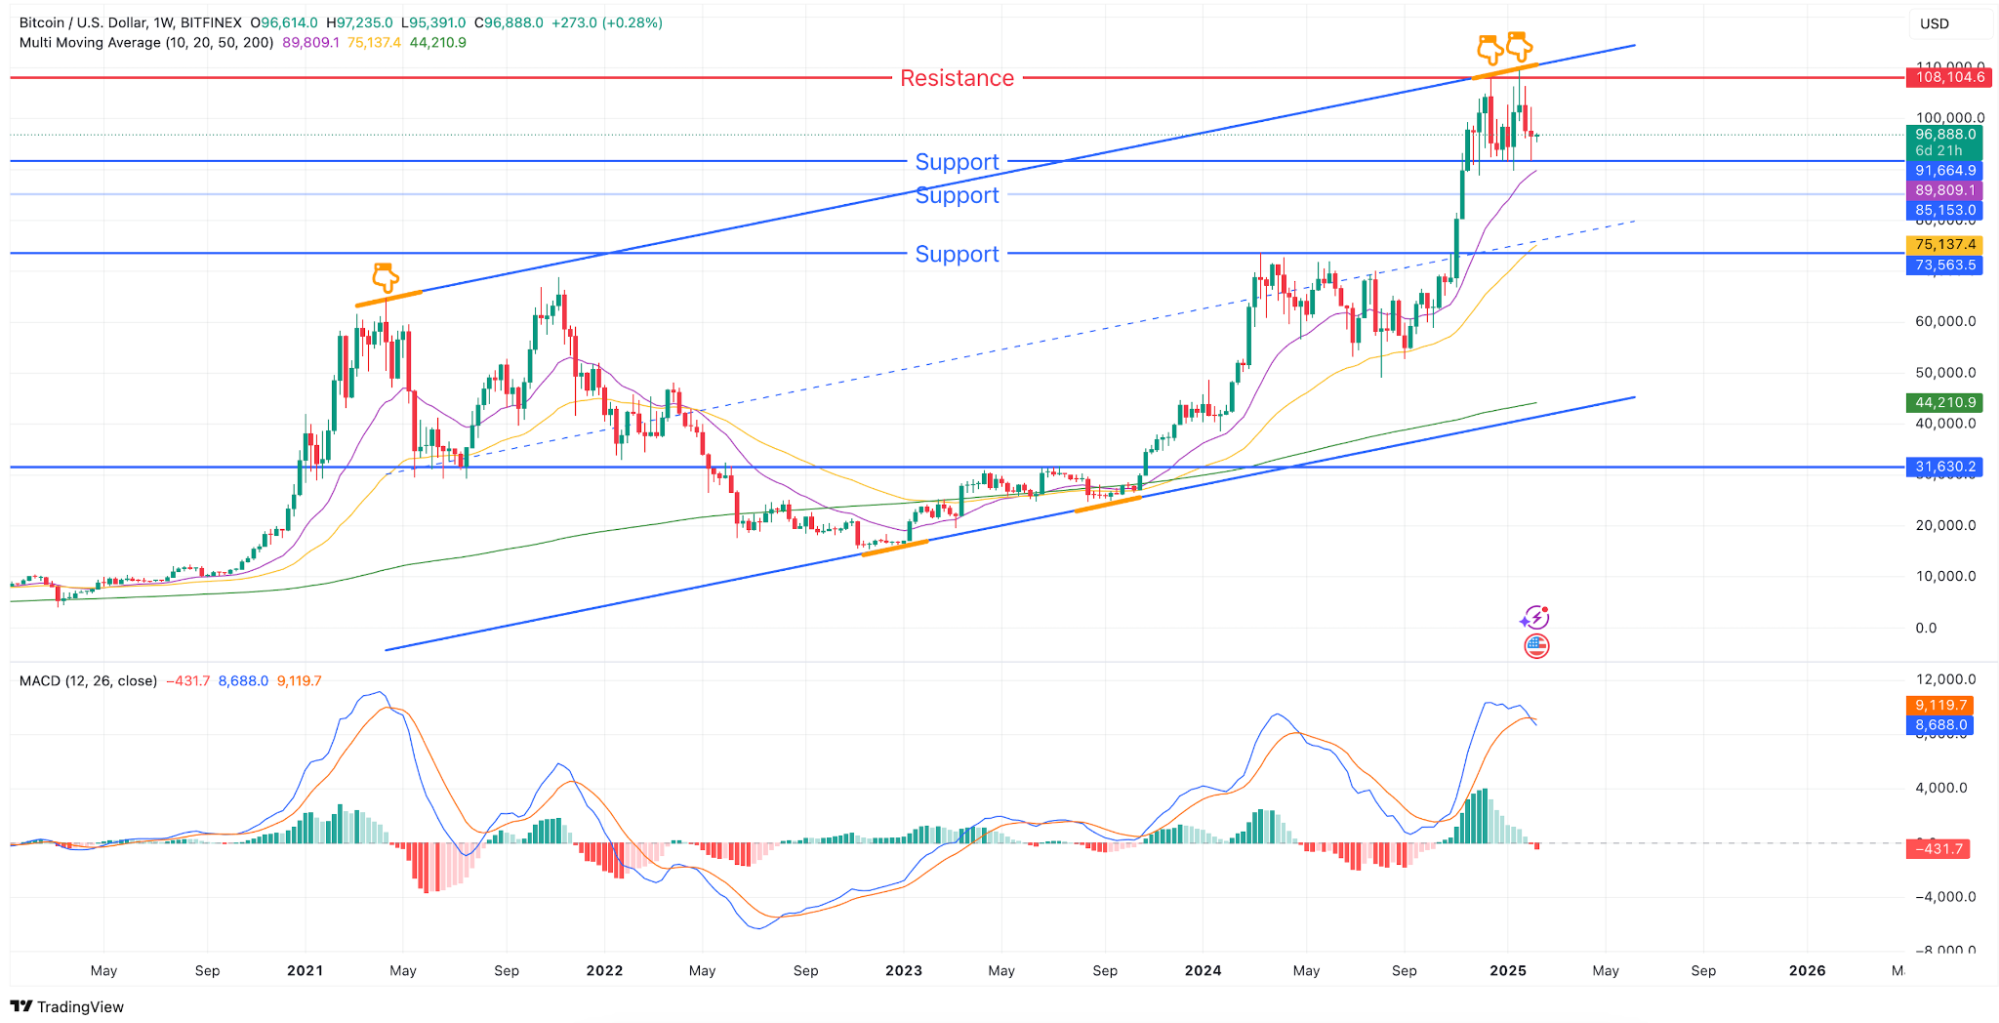
Summary
The weekly MACD’s dead cross injects bearish pressure. Resistance at $108,104.6 limits rebounds, while MACD and Stochastic suggest a continued downtrend. Support at $91,664.9 and $73,563.5 could be key in determining the next move.
Daily Chart: Key Price Levels
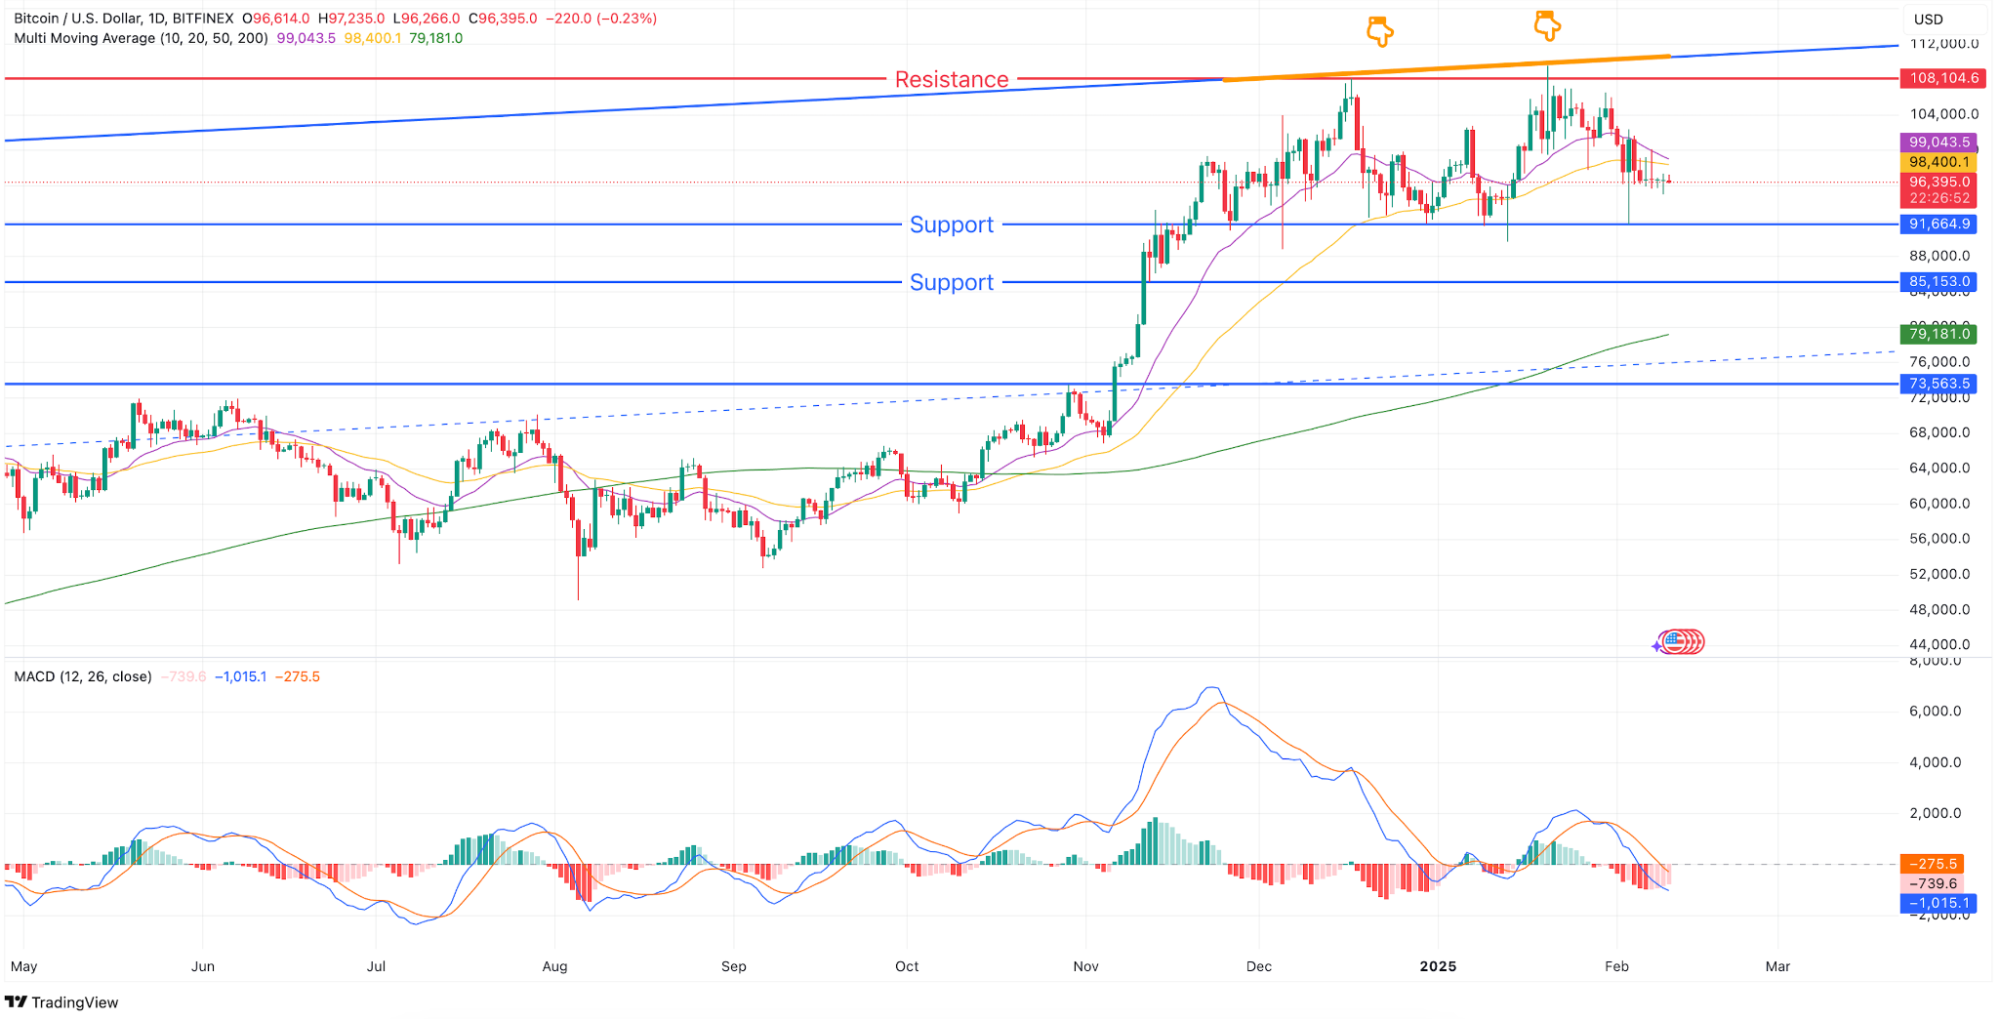
- Trend: Neutral
- Support: $91,664.9
- Resistance: $108,104.6
- MACD: Negative histogram with a dead cross, signaling short-term bearishness.
- Moving Averages: BTC trades below the 50MA ($98,400.1) but above the 200MA ($79,181), showing short-term pressure but long-term support.
Summary
The daily chart suggests caution. While long-term support holds, bearish MACD signals hint at further declines if support breaks.
4-Hour Chart: Key Price Levels
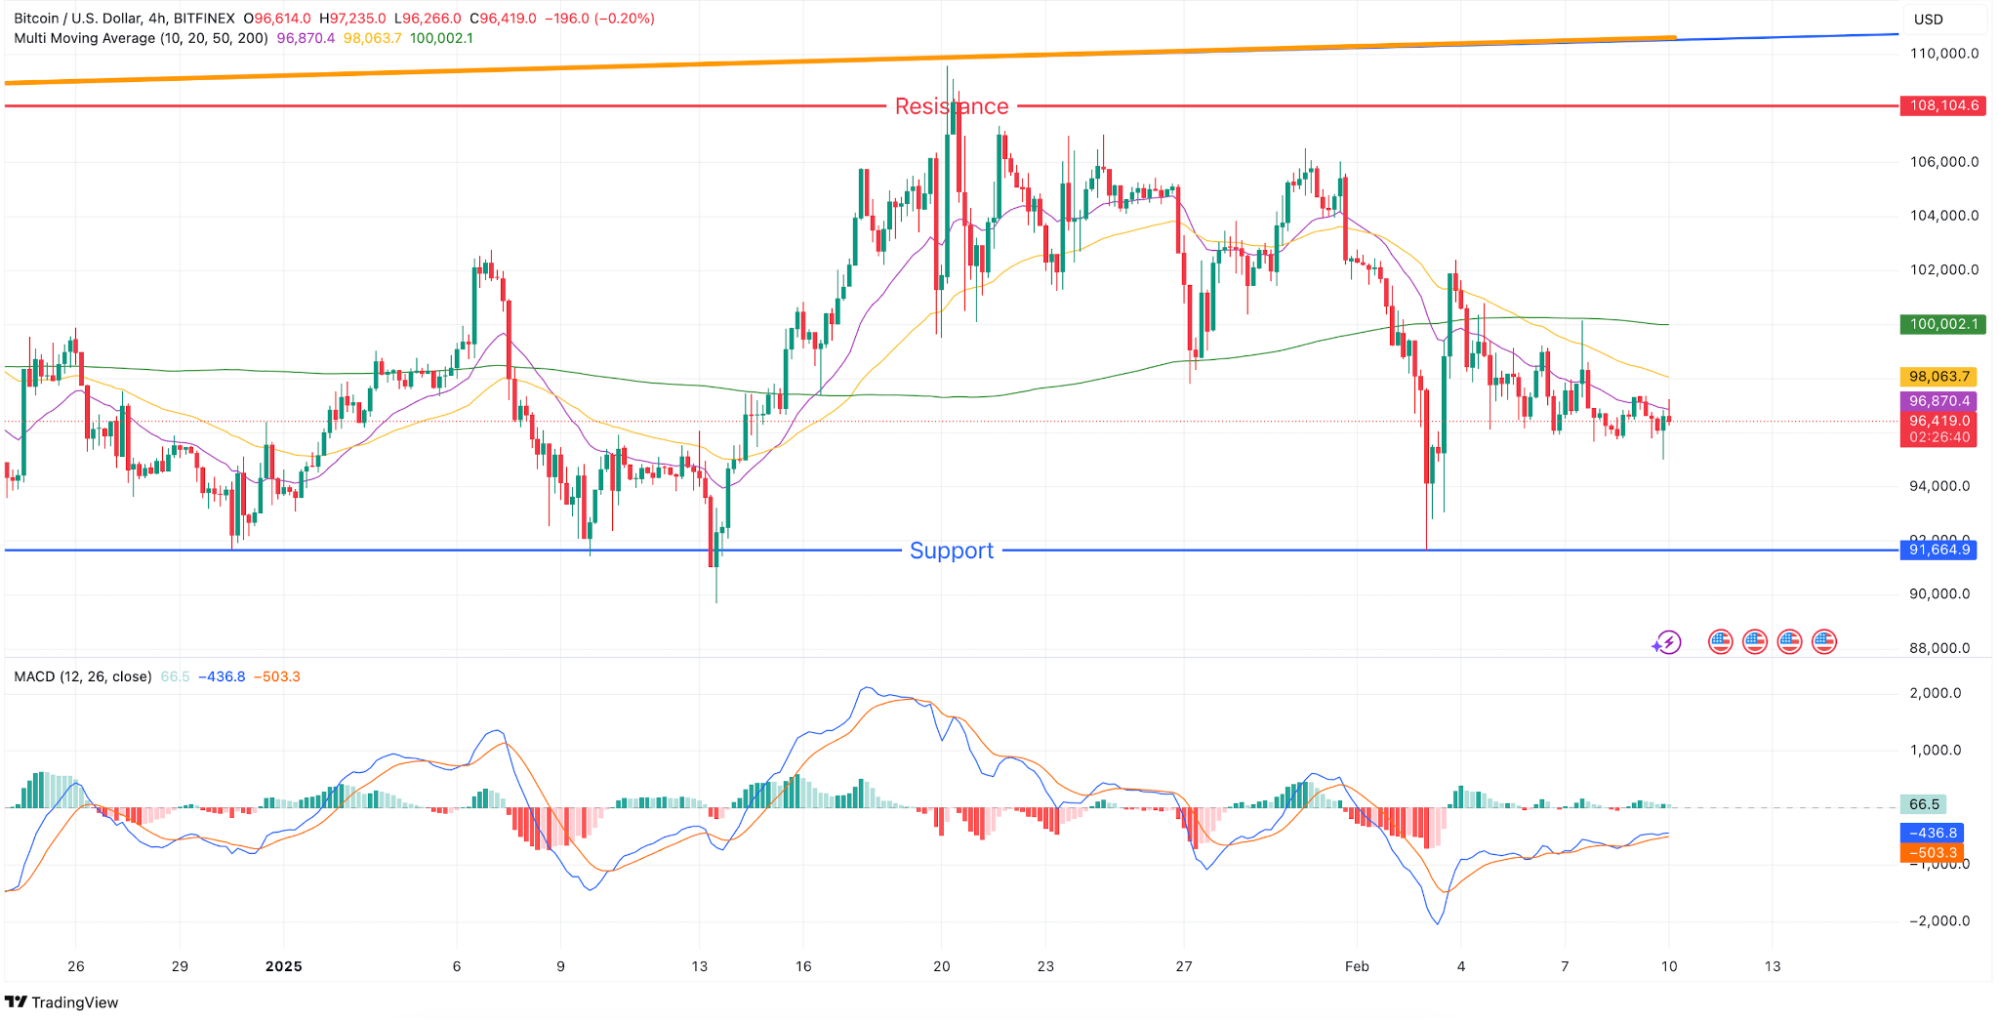
- Trend: Neutral
- Support: $91,664.9
- Resistance: $108,104.6
- MACD: Positive histogram with a golden cross, hinting at a bullish shift.
- Moving Averages: BTC trades below both 50MA ($98,063.7) and 200MA ($100,002.1), indicating overall bearish sentiment.
Summary
Mixed signals. MACD suggests a bullish shift, but price remains below moving averages. Resistance at $108,104.6 is key.
1-Hour Chart: Key Price Levels
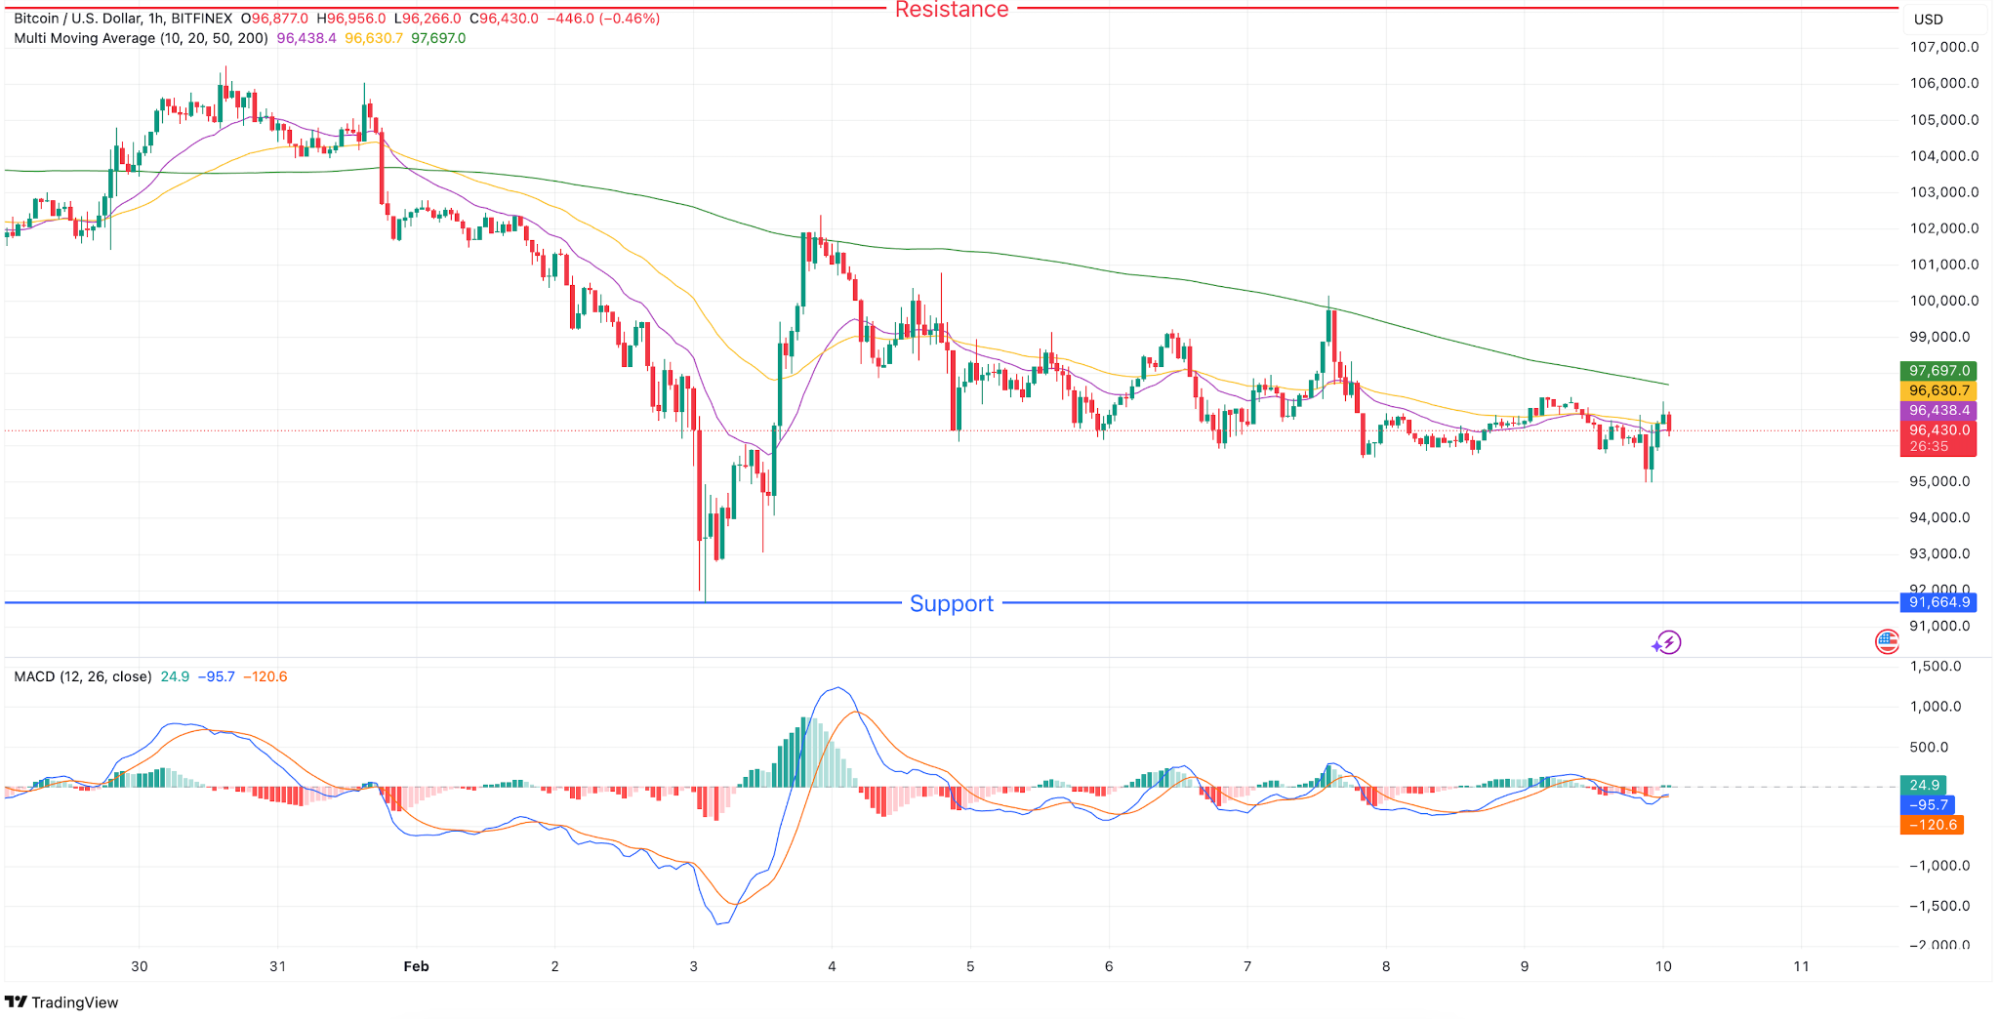
- Trend: Neutral
- Support: $91,664.9
- Resistance: $108,104.6
- MACD: Negative histogram nearing neutral, indicating indecision. Both golden and dead crosses signal short-term volatility.
- Moving Averages: BTC trades just below the 50MA ($96,630.7) and 200MA ($97,697), suggesting slight bearish pressure with breakout potential.
Summary
The market is at a turning point. Hovering near moving averages with mixed MACD signals, traders should watch for breakouts.
Conclusion
Bitcoin shows mixed signals across timeframes. The weekly dead cross suggests long-term bearishness, while shorter timeframes hint at potential recovery. Resistance at $108,104.6 remains a major hurdle, with $91,664.9 as crucial support. Watch the 4-hour and daily charts for trend confirmation that could define Bitcoin’s next major move.
Beginner Friendly Glossary
Resistenace Line
A price level where selling pressure prevents further rise. Breaking this line often signals a potential uptrend.
Learn more
Death Cross
Occurs when a short-term moving average crosses below a long-term moving average, indicating bearish momentum.
Learn more
Breakout
When the price moves above resistance or below support, suggesting the start of a new trend, especially with high volume.
Learn more
DISCLAIMER: THE CONTENT PROVIDED IN THIS ARTICLE IS FOR INFORMATIONAL PURPOSES ONLY AND SHOULD NOT BE CONSIDERED FINANCIAL, LEGAL, OR INVESTMENT ADVICE. CRYPTOCURRENCY INVESTMENTS CARRY A HIGH DEGREE OF RISK AND MAY NOT BE SUITABLE FOR EVERY INVESTOR. PAST PERFORMANCE DOES NOT GUARANTEE FUTURE RESULTS. THIS ANALYSIS IS INTENDED PURELY AS AN OBSERVATION OF SPECIFIC PRICE LEVELS AND TRENDS TO AID IN UNDERSTANDING POTENTIAL MARKET DIRECTIONS. YOU ARE ENCOURAGED TO DO YOUR OWN RESEARCH AND CONSULT WITH A LICENSED PROFESSIONAL BEFORE MAKING ANY FINANCIAL DECISIONS. THE INFORMATION HEREIN IS CURRENT AS OF THE PUBLICATION DATE AND MAY CHANGE WITHOUT NOTICE.