KEY INSIGHTS
- Bitcoin has remained stable above the critical $100,000 level despite a slight pullback, reflecting strong investor confidence and long-term stability.
- The weekly chart highlights an upward channel, but resistance at the top has triggered a pullback, suggesting potential challenges to maintaining upward momentum.
- Short-term timeframes (4-hour and 1-hour) indicate bearish pressure, with MACD Dead Cross signals and price struggling below key moving averages, emphasizing the need for caution in the short term.
Introduction
Review of the Previous Week:
Bitcoin (BTC/USD) saw notable movement last week, briefly climbing to $109,561.4 before retracing to the $100,000 level, where it formed a small consolidation range. Despite short-term bearish signals on the MACD, Bitcoin held above key moving averages, highlighting its long-term stability and resilience.
Market Changes Since Last Week:
Optimism surrounding President Trump’s proposed cryptocurrency policies has driven recent price increases, capturing significant market attention.
However, as the market shifts from speculation to evaluating the tangible impact of these policies, a slight pullback in BTC’s price has occurred. Even with this adjustment, Bitcoin has remained firmly above the $100,000 threshold, underscoring its appeal as a reliable asset amid shifting sentiment.
With the Federal Open Market Committee (FOMC) meeting and other key U.S. economic indicators scheduled for release this week, all eyes are on how these developments will influence Bitcoin’s price and the broader market in the coming days.
Detailed Analysis
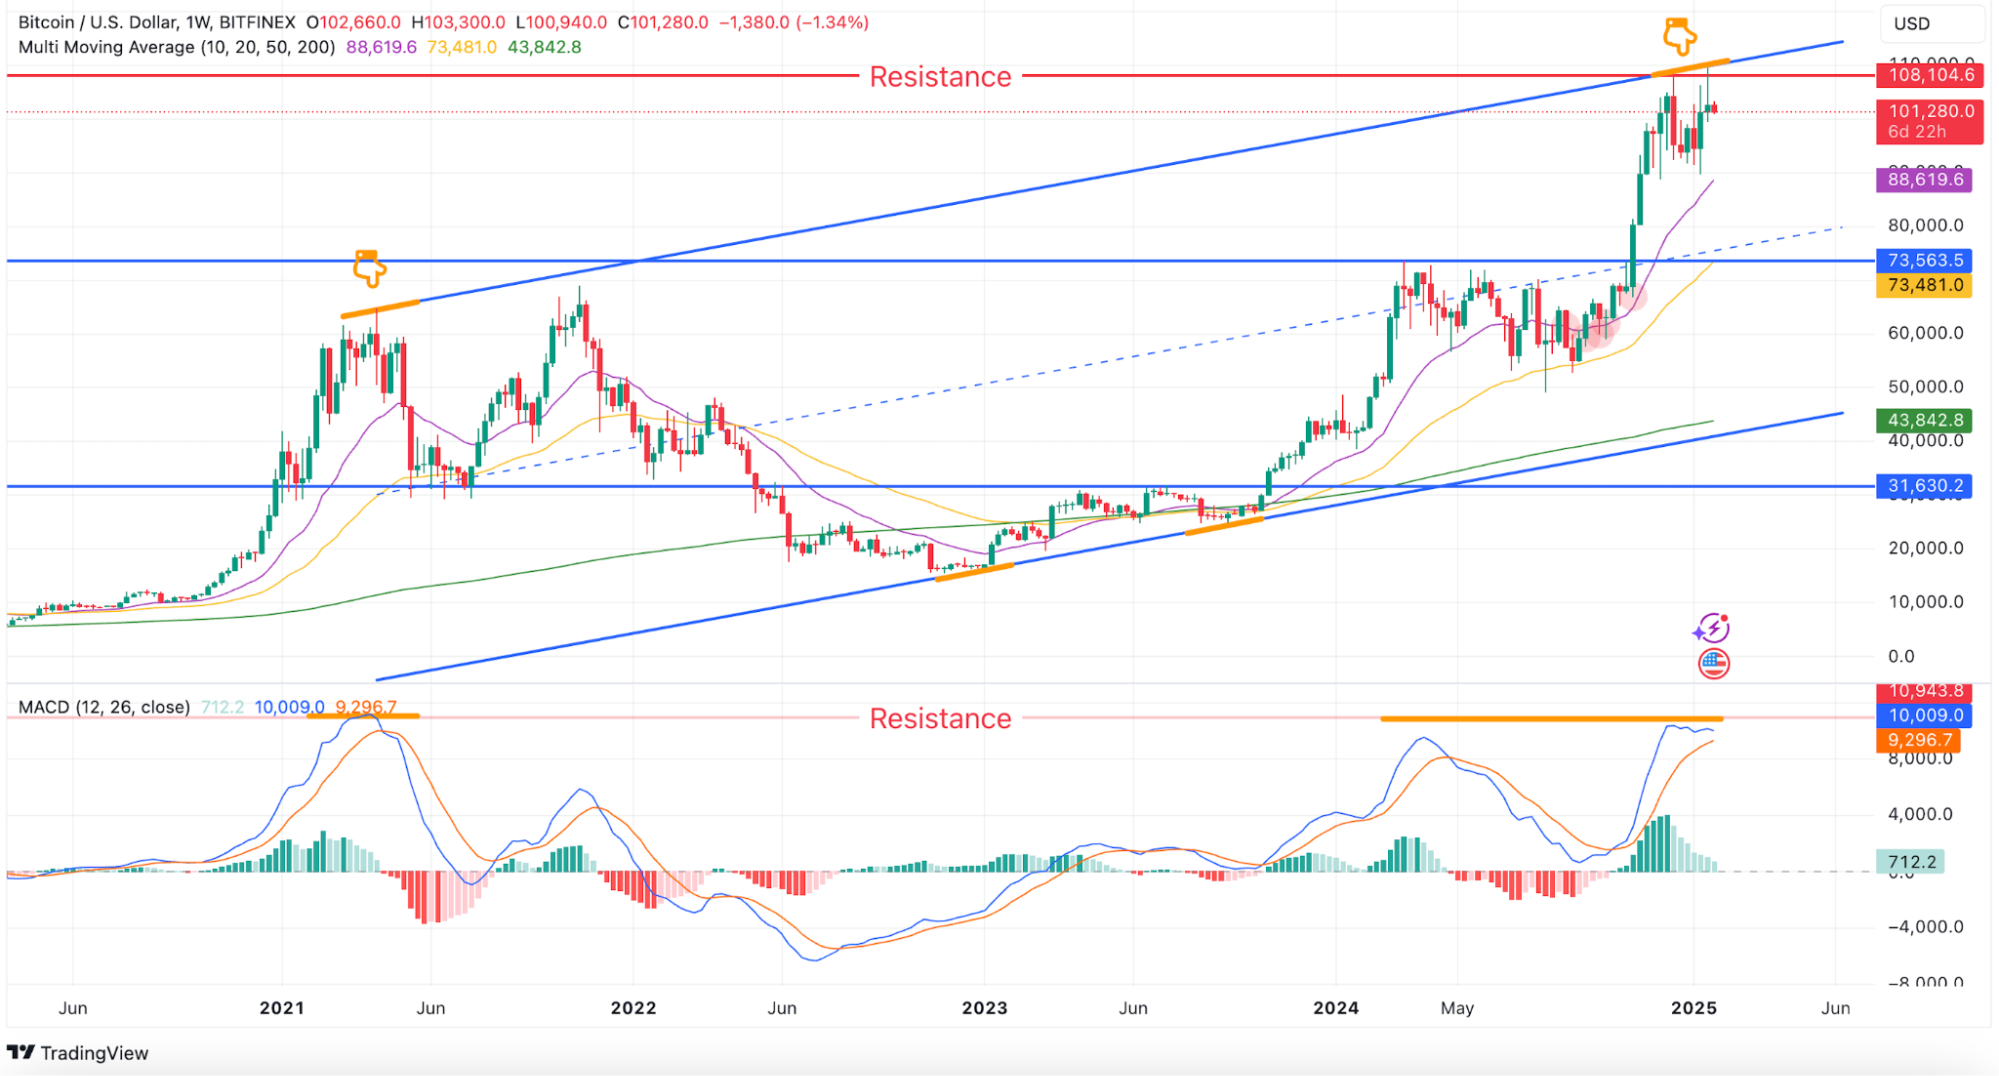
Weekly Chart: Key Price Levels
Summary
At the weekly level, Bitcoin remains within an upward channel, with the price pulling back after reaching the resistance line at the top of the channel. The strong upward trend persists, but resistance at higher levels is becoming more pronounced. The MACD, currently at a level similar to its 2021 peak, raises questions about whether Bitcoin will continue to rise or enter a correction phase.
Daily Chart: Key Price Levels
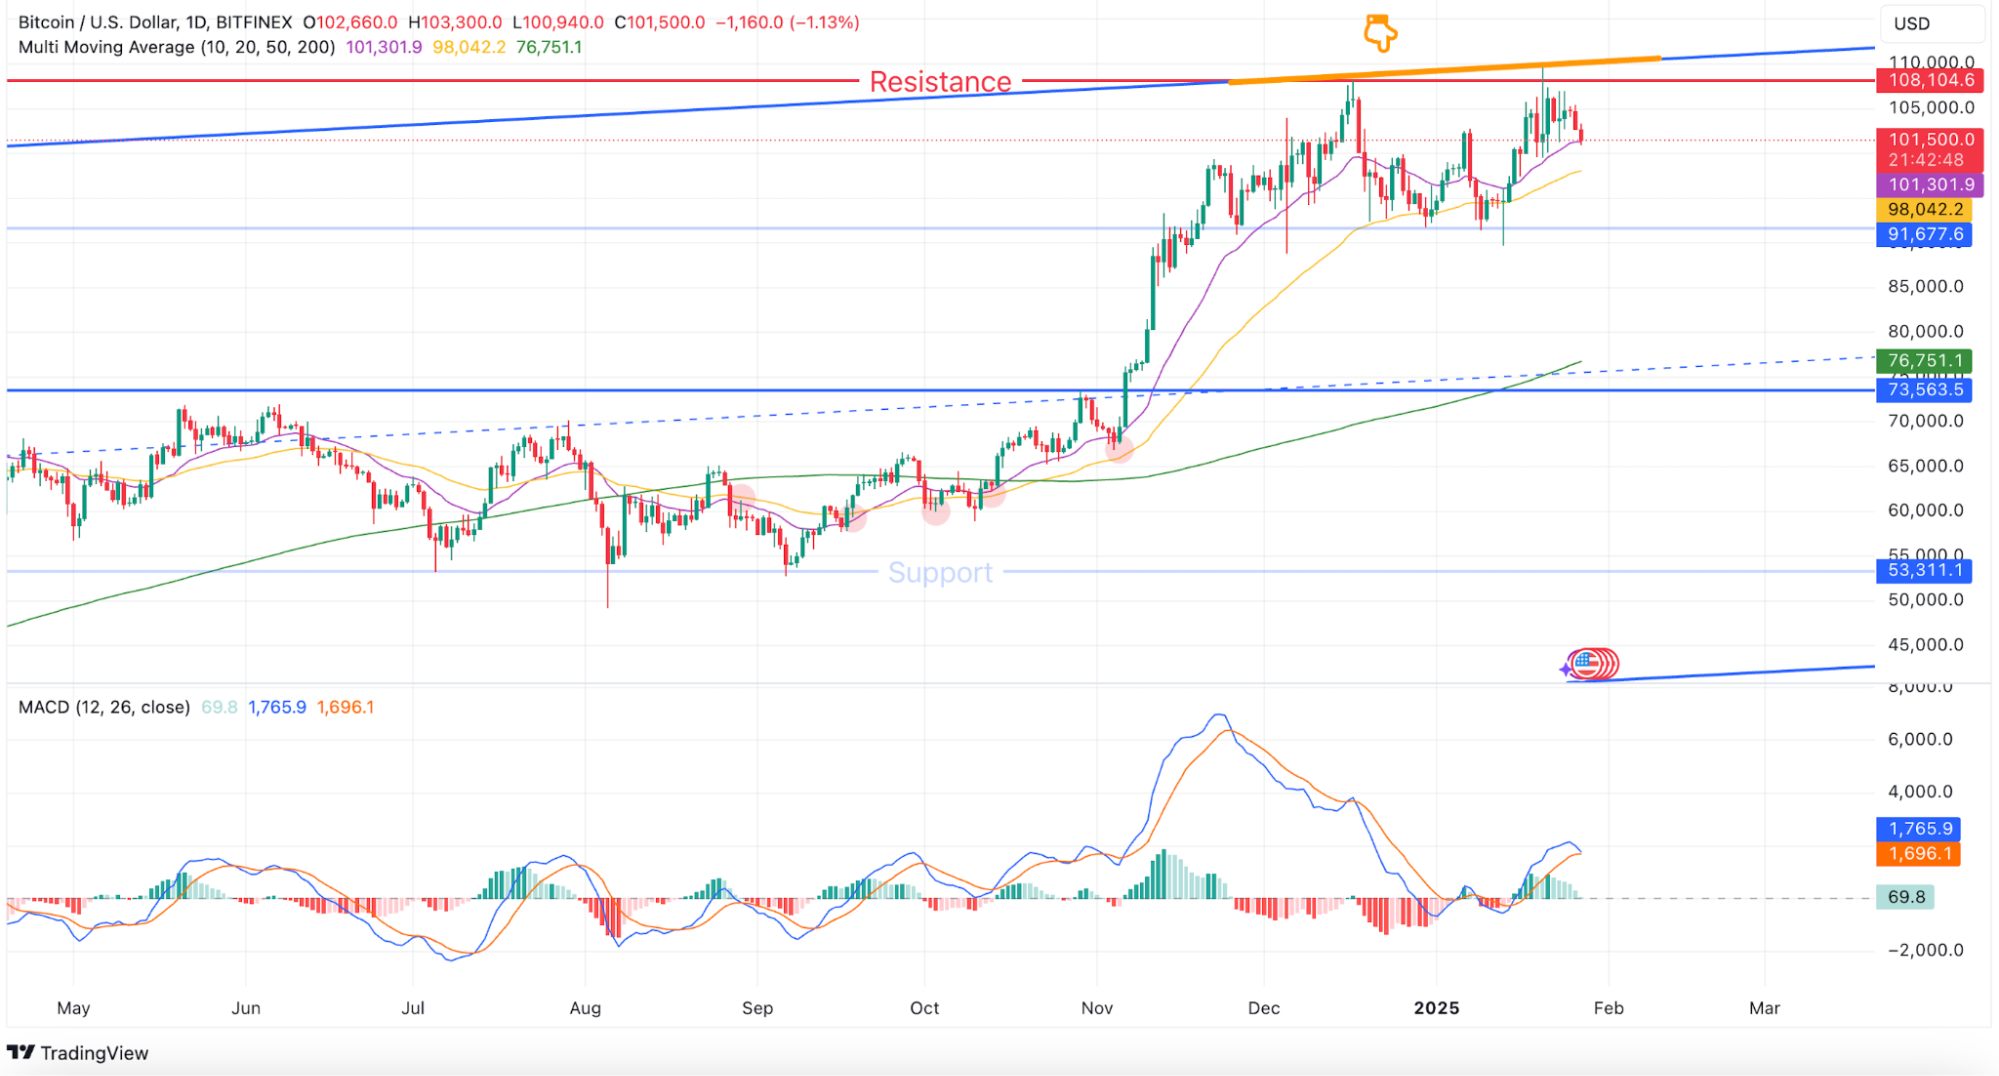
- Trend: Upward
- Support Level: $91,677.6
- Resistance Level: $108,104.6
- MACD Analysis: Positive histogram with an Almost Dead Cross on MACD, signaling weakening bullish momentum. The MACD line is 69.8 points above the signal line.
- Moving Averages: The current price ($100,500) is above the 50-day MA ($98,042.2) by approximately 2.5% and significantly above the 200-day MA ($76,751.1), reflecting strong long-term bullish sentiment.
Summary
The daily chart reflects an upward trend, but the Almost Dead Cross on MACD suggests caution as bullish momentum weakens. Resistance at $108,104.6 remains a critical level to watch for a potential breakout or rejection.
4-Hour Chart: Key Price Levels
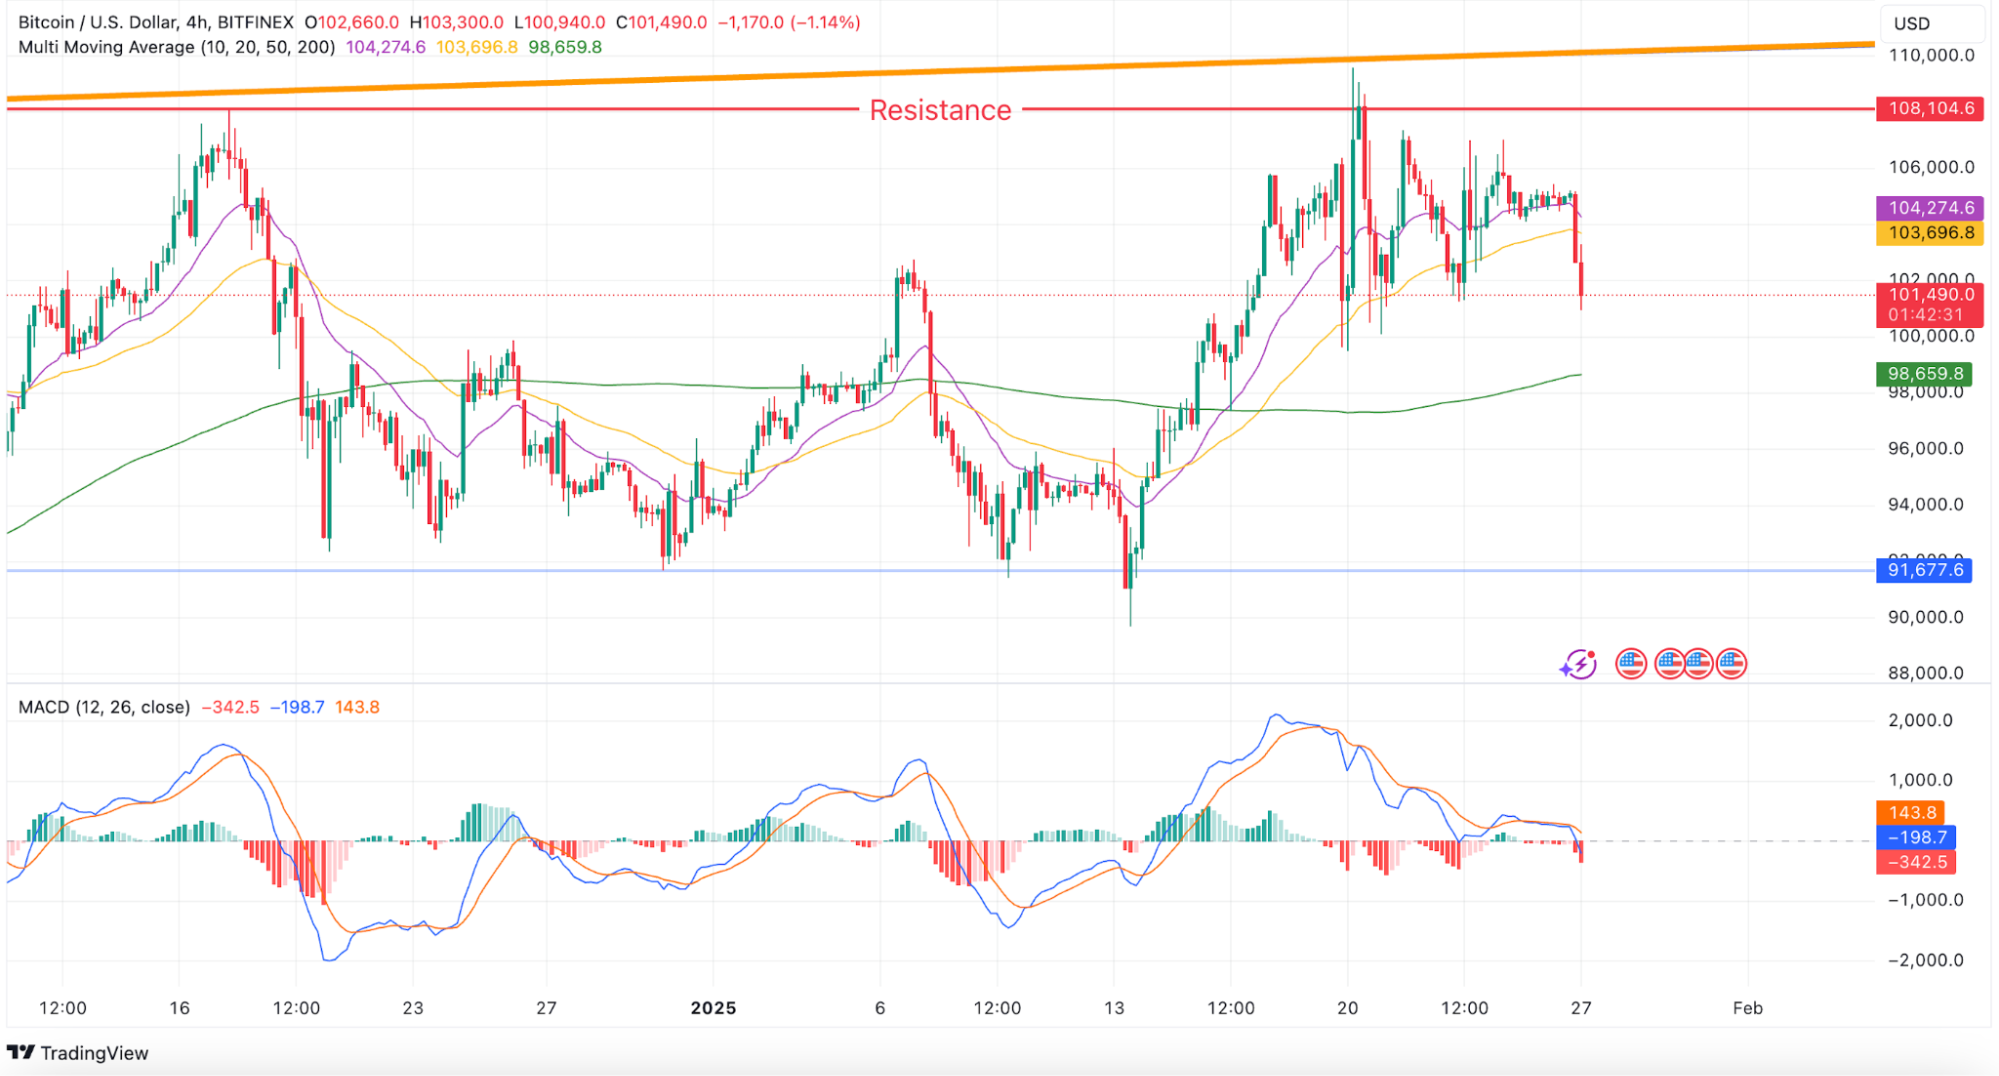
- Trend: Neutral
- Support Level: $91,677.6
- Resistance Level: $108,104.6
- MACD Analysis: Negative histogram with a Dead Cross on MACD, signaling bearish momentum. The MACD line is -342.5 points below the signal line.
- Moving Averages: The current price ($100,500) is below the 50MA ($103,696.8) by approximately 3% and slightly above the 200MA ($98,659.8) by 1.8%, indicating consolidation with bearish pressure.
Summary
The 4-hour chart shows neutral momentum but signals bearish pressure from the MACD Dead Cross. Price movement remains constrained by the 50MA, with resistance at $108,104.6 as a key level for further recovery.
1-Hour Chart: Key Price Levels
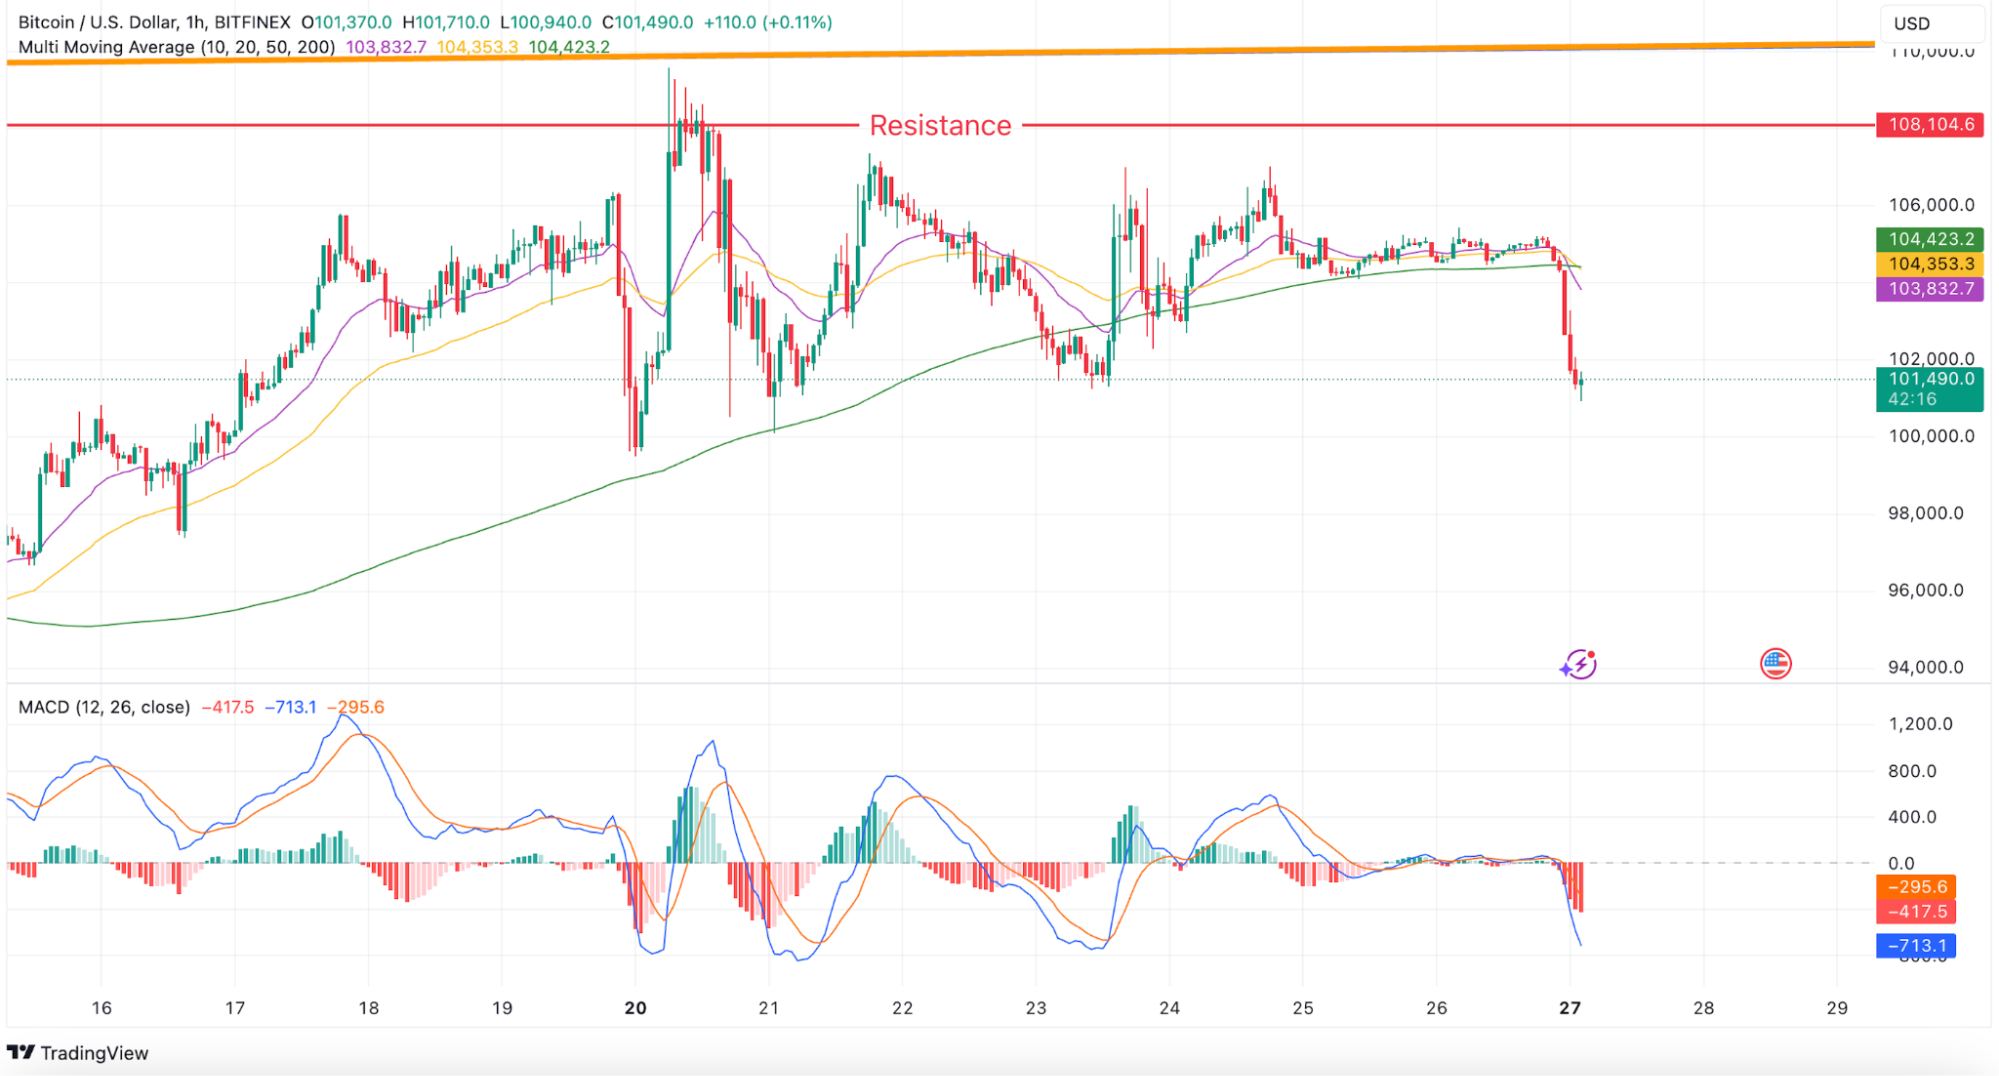
- Trend: Downward
- Support Level: $91,677.6
- Resistance Level: $108,104.6
- MACD Analysis: Negative histogram with a Dead Cross on MACD, signaling continued bearish momentum. The MACD line is -295.6 points below the signal line.
- Moving Averages: The current price ($100,500) is below the 50MA ($104,353.3) by approximately 3.7% and below the 200MA ($104,423.2) by 3.8%, reflecting strong downward pressure.
Summary
The 1-hour chart indicates a downward trend, with bearish momentum confirmed by the MACD Dead Cross. Support at $91,677.6 is critical to monitor for any potential recovery.
Conclusion
Bitcoin’s price presents mixed signals across timeframes. The weekly chart shows an upward trend within a parallel channel, but resistance at the upper boundary has led to a pullback. While the daily chart remains bullish, weakening momentum on the MACD raises caution. Shorter timeframes, such as the 4-hour and 1-hour charts, reveal bearish pressure, with the price struggling below key moving averages.
The key question is whether Bitcoin can retest and break above the parallel channel. If not, the focus shifts to whether support at $91,677.6 will hold, making it a critical level to watch in the short term.
Beginner Friendly Glossary
Parallel Channel
A technical pattern where price moves within two parallel trendlines, representing support and resistance levels.
Learn more
Support Level
A price level where demand is thought to be strong enough to prevent further decline, acting as a “floor” for the price.
Learn more
Resistance Level
A price level where selling pressure prevents further price increases, acting as a “ceiling” for the price.
Learn more
Histogram
A visual representation of the difference between the MACD line and the signal line, used to measure momentum strength.
Learn more
Consolidation Range
A period where the price moves within a narrow range, indicating indecision in the market before a breakout or breakdown.
Learn more
FOMC (Federal Open Market Committee)
A branch of the Federal Reserve responsible for monetary policy decisions that can impact markets, including Bitcoin prices.
Learn more
DISCLAIMER: THE CONTENT PROVIDED IN THIS ARTICLE IS FOR INFORMATIONAL PURPOSES ONLY AND SHOULD NOT BE CONSIDERED FINANCIAL, LEGAL, OR INVESTMENT ADVICE. CRYPTOCURRENCY INVESTMENTS CARRY A HIGH DEGREE OF RISK AND MAY NOT BE SUITABLE FOR EVERY INVESTOR. PAST PERFORMANCE DOES NOT GUARANTEE FUTURE RESULTS. THIS ANALYSIS IS INTENDED PURELY AS AN OBSERVATION OF SPECIFIC PRICE LEVELS AND TRENDS TO AID IN UNDERSTANDING POTENTIAL MARKET DIRECTIONS. YOU ARE ENCOURAGED TO DO YOUR OWN RESEARCH AND CONSULT WITH A LICENSED PROFESSIONAL BEFORE MAKING ANY FINANCIAL DECISIONS. THE INFORMATION HEREIN IS CURRENT AS OF THE PUBLICATION DATE AND MAY CHANGE WITHOUT NOTICE.