KEY INSIGHTS
Weekly Candle Suggests Trend Shift: A bearish candle signals a potential trend shift, with a possibility of downward movement.
Key Resistance Lines at $99,554 and $102,802.9: These price levels are major focal points for short-term price movements.
Role Shift of the 200-Day Moving Average on the 4-Hour Chart: The 200-day moving average may act as a resistance zone in the short term, potentially attracting significant attention.
Introduction
Reflections on the Previous Analysis
Last week’s article analyzed Bitcoin surpassing the psychological milestone of $100,000 and reaching a high of $106,503. Following this, adjustments were observed, with $104,012.4 and $101,919.5 highlighted as critical support levels. The 200-day moving average was also functioning as a key factor supporting short-term price movements.
Price Review & Summary of Last Week’s Analysis
Bitcoin recorded a high of $106,503, followed by a brief dip below $100,000. Currently, $99,554 and $102,802.9 are notable price levels acting as resistance lines. These levels have proven to play significant roles in indicating price trends.
Market Analysis & Price Action
The current market is focused on price movements within the resistance zone. In particular, $99,554 and $102,802.9 are key resistance lines expected to influence short-term price trends.
Detailed Analysis
Weekly Chart: Overall Movements
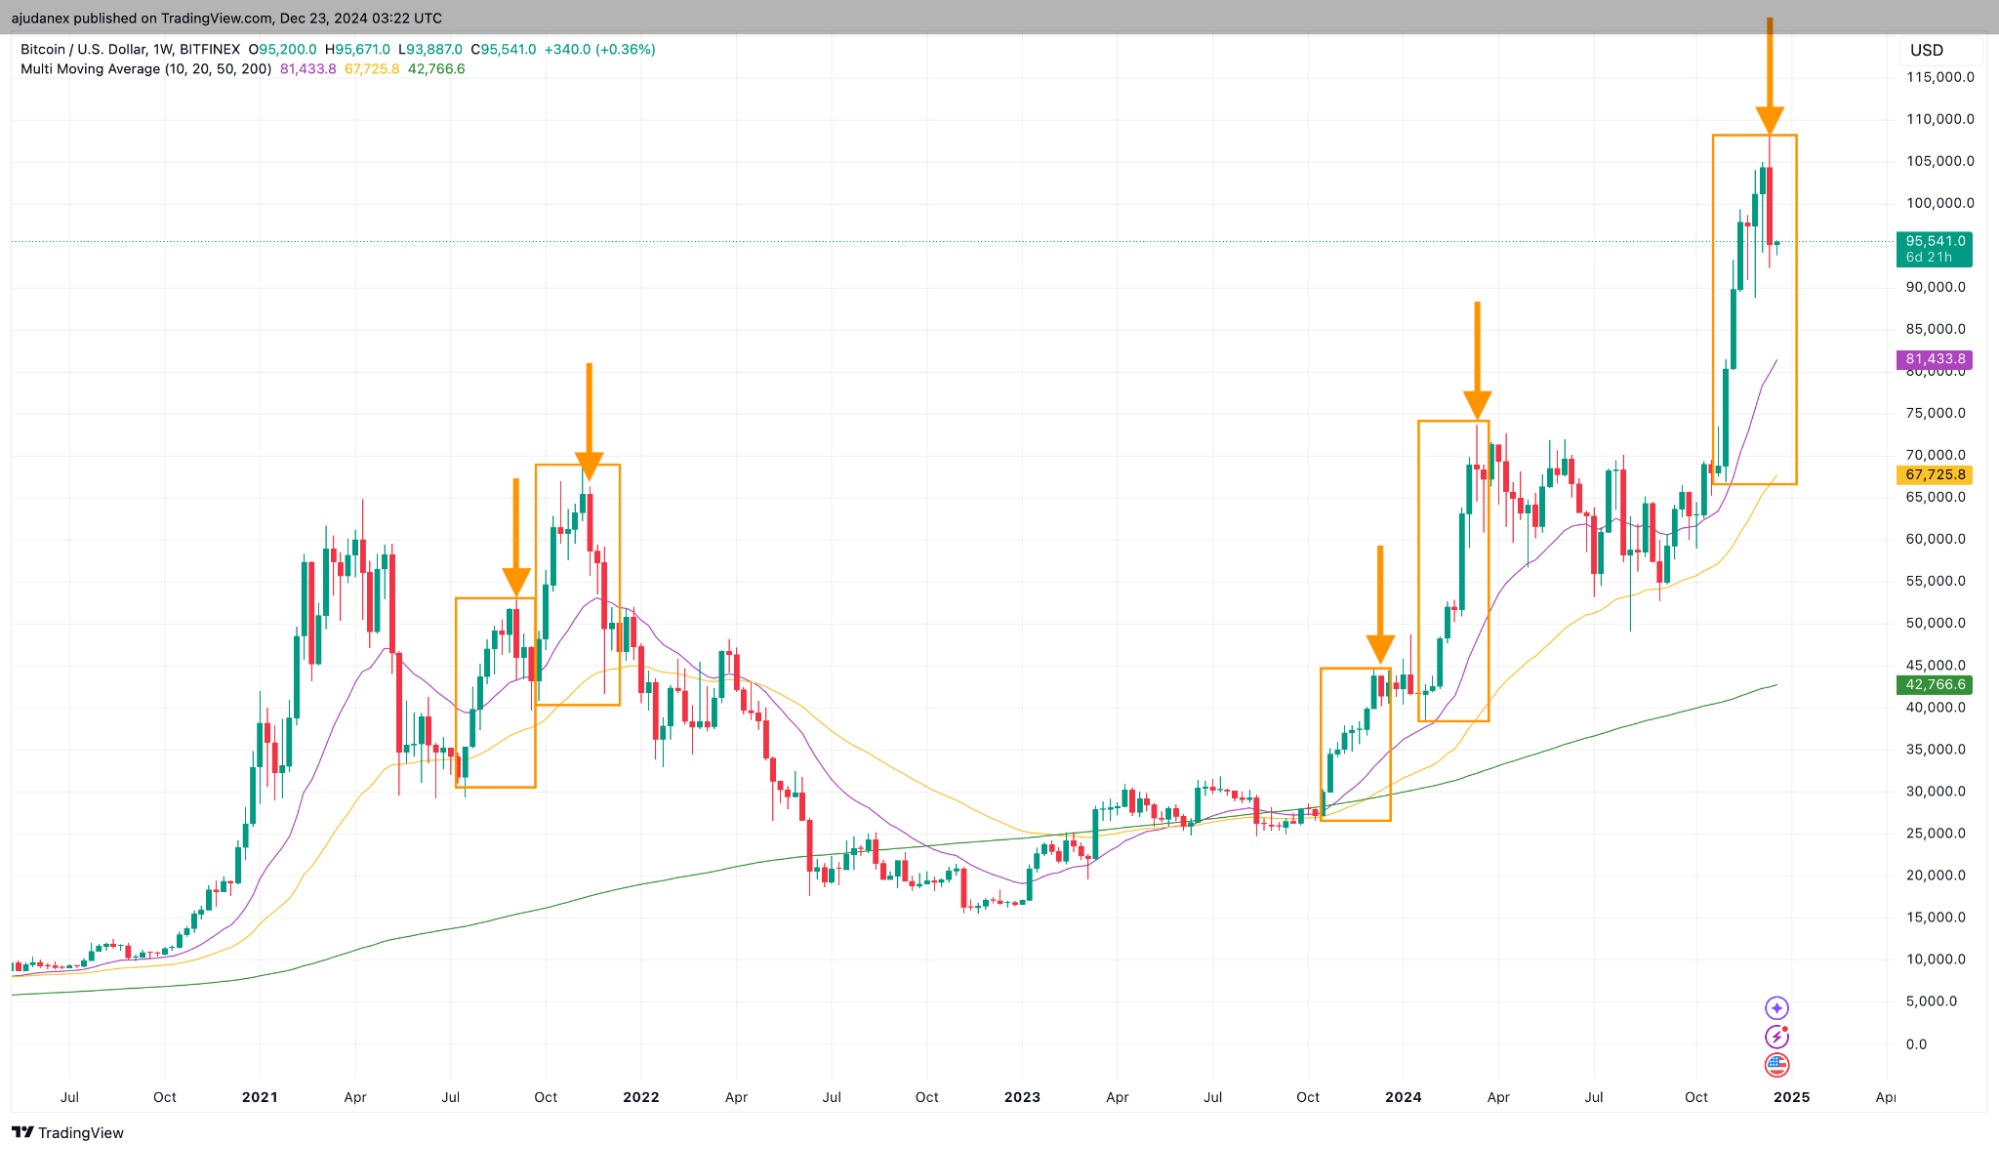
- Formation of a Bearish Candle: The bearish weekly candle aligns with previous patterns that suggest transitions to downtrends.
Daily Chart: Key Price Levels
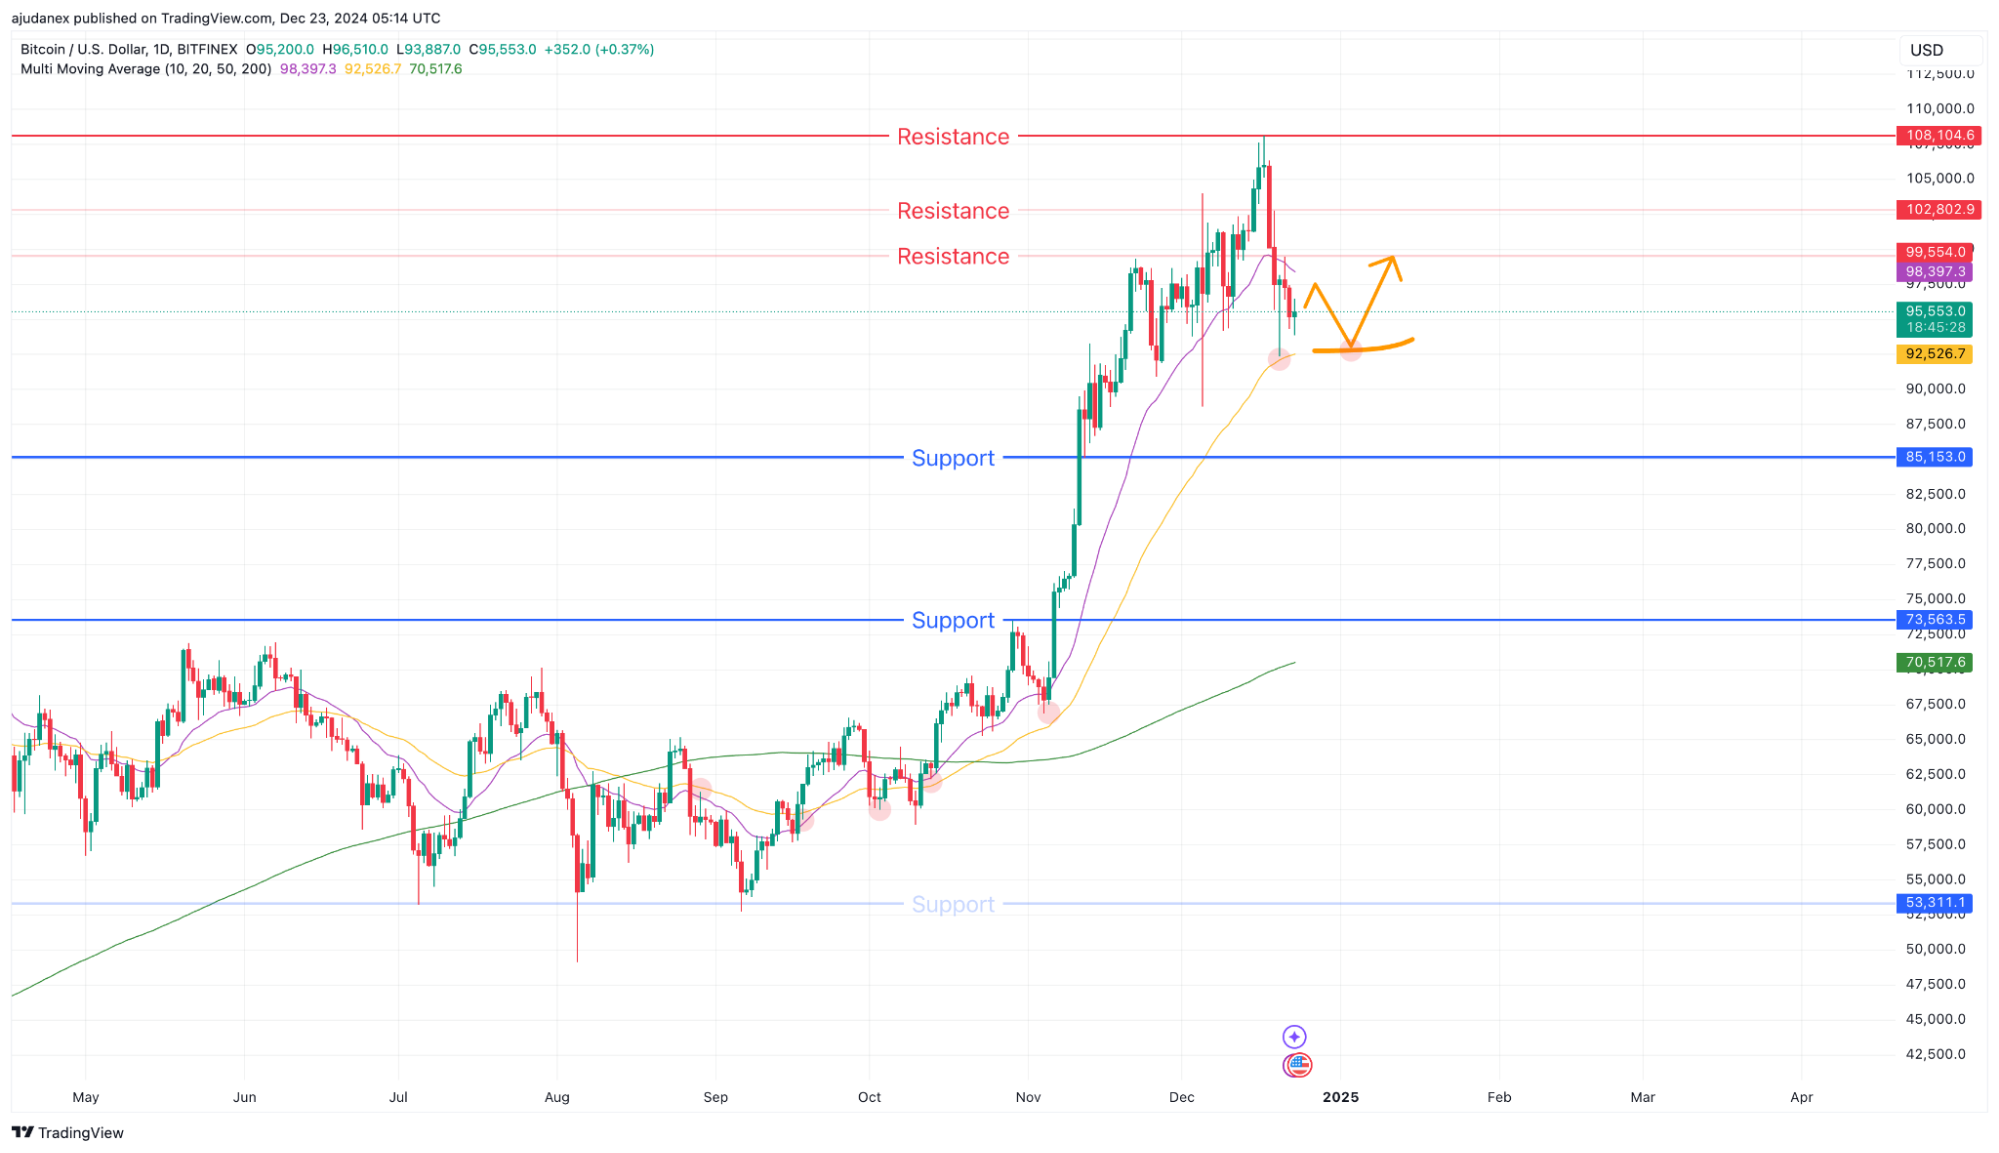
- 50-Day Moving Average: The 50-day moving average continues to be a point of interest to determine if it remains as a support line.
4-Hour Chart: Key Price Levels
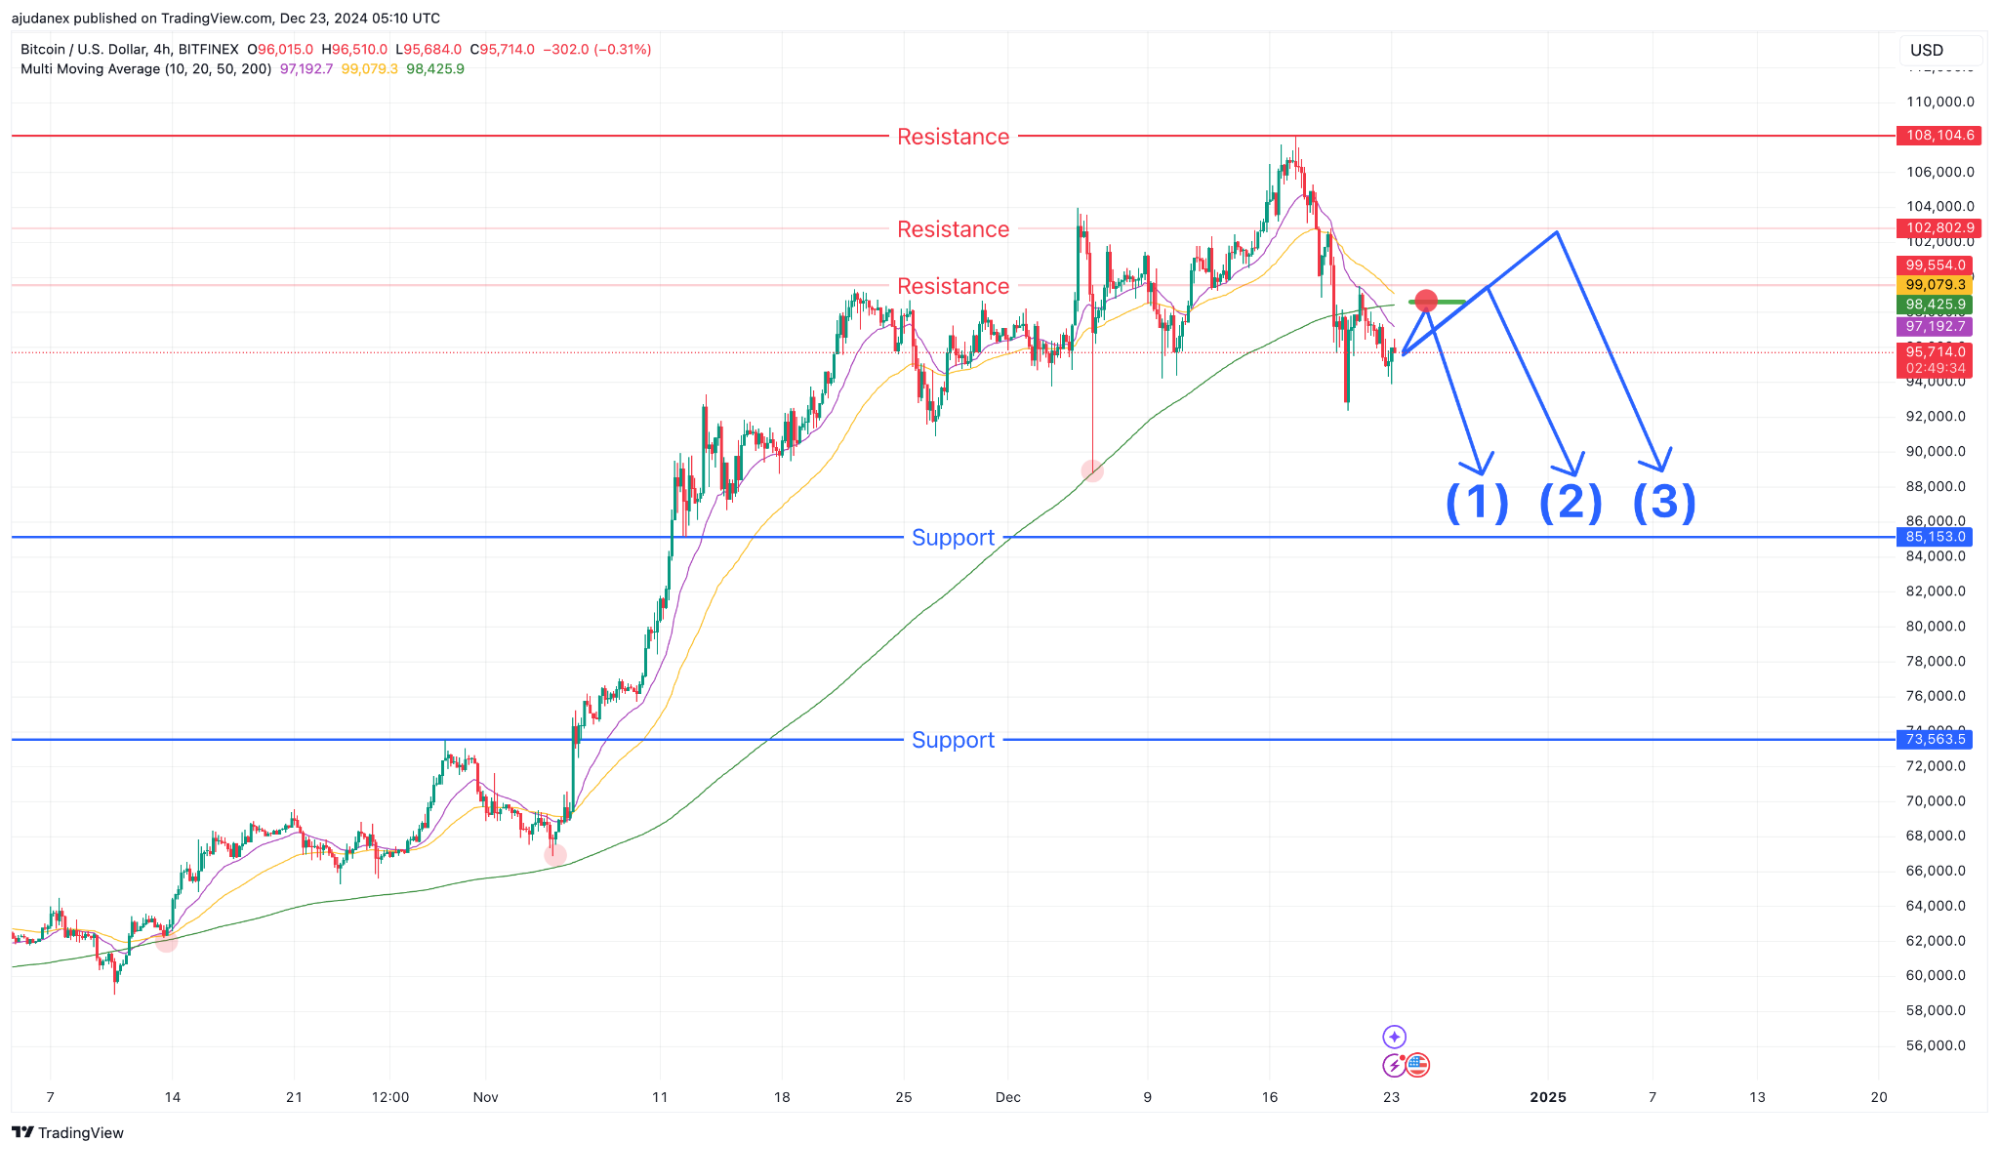
- Key Price Levels:
- $99,554: Recognized as the most recent high.
- $102,802.9: Identified as the preceding high, significant for its influence on the market.
- 200-Day Moving Average Dynamics: The 200-day moving average may act as a resistance zone, with movements near this level garnering attention.
1-Hour Chart: Key Price Levels
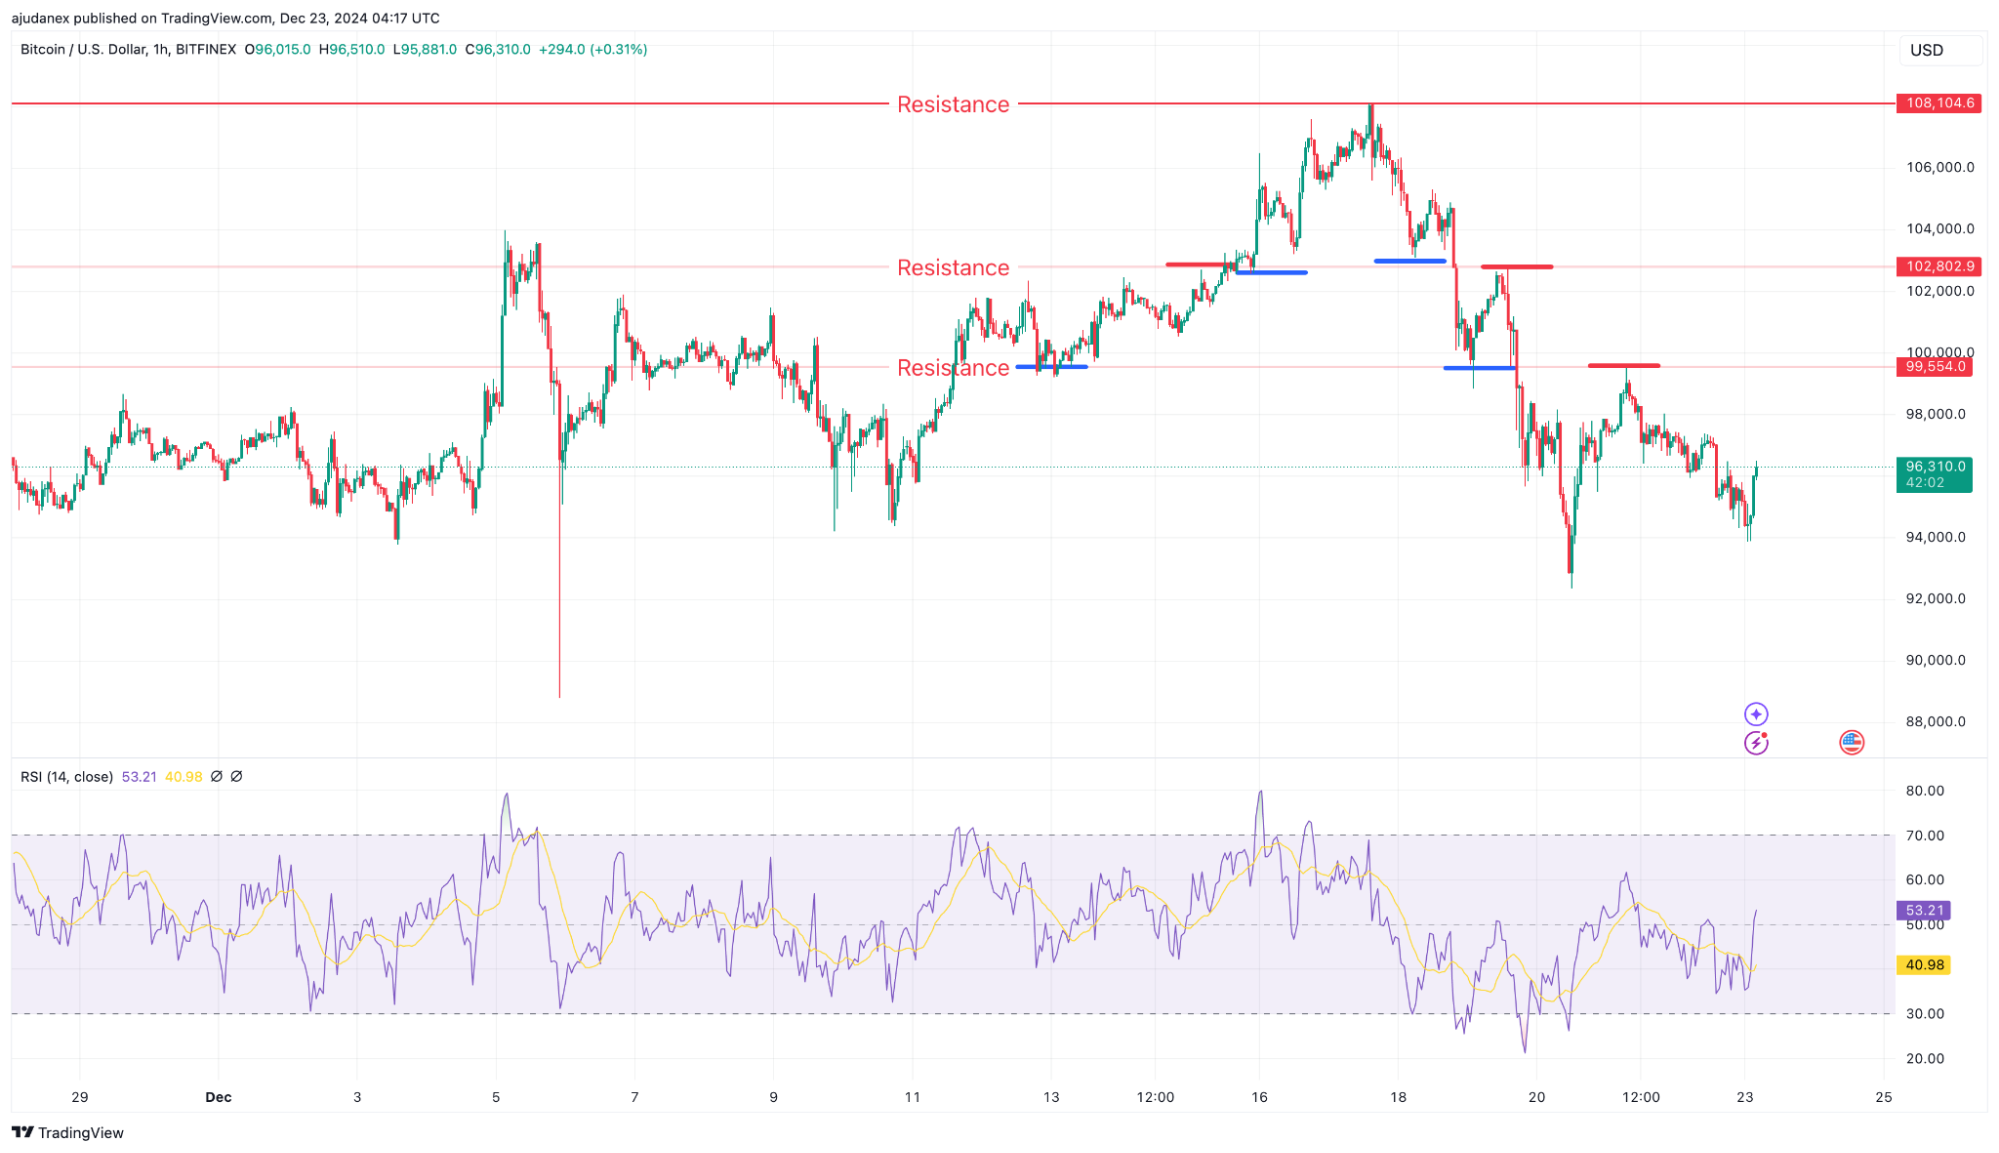
- Key Points of Interest
- $99,554: The most recent high, attracting market attention.
- $102,802.9: A previous high, serving as a critical price level.
Figure Caption: The red line was a resistance, and the blue line a support, both potentially remaining relevant.
Conclusion
Currently, Bitcoin’s price movements are being closely observed within the resistance zone. In particular, $99,554 and $102,802.9 are resistance lines that, along with the role of the 200-day moving average, are likely to influence short-term price trends. Observing activity at these levels may provide insights into the market’s future direction.
Beginner Friendly Glossary
- Red Candle
A key level where selling pressure slows down upward momentum, often aligning with previous highs or psychological levels. Resistance can indicate potential reversals or breakouts..
Learn more here - Resistance Lines
Resistance is the opposite of support. Prices move up because there is more demand than supply. As the prices move higher, there will come a point when selling will overwhelm buying.
Learn more here - Moving Average
An indicator that helps traders in smoothing out price fluctuations and determining the actual trend. The basic idea behind the moving average is to take the average price for an X amount of periods of an asset.
Learn more here - Role Reversal
A support and resistance role reversal is when support becomes resistance or vice versa because these levels are broken. When the price breaks through a support or resistance level and then goes back to its original range it’s called a reversal.
Learn more here
DISCLAIMER: THE CONTENT PROVIDED IN THIS ARTICLE IS FOR INFORMATIONAL PURPOSES ONLY AND SHOULD NOT BE CONSIDERED FINANCIAL, LEGAL, OR INVESTMENT ADVICE. CRYPTOCURRENCY INVESTMENTS CARRY A HIGH DEGREE OF RISK AND MAY NOT BE SUITABLE FOR EVERY INVESTOR. PAST PERFORMANCE DOES NOT GUARANTEE FUTURE RESULTS. THIS ANALYSIS IS INTENDED PURELY AS AN OBSERVATION OF SPECIFIC PRICE LEVELS AND TRENDS TO AID IN UNDERSTANDING POTENTIAL MARKET DIRECTIONS. YOU ARE ENCOURAGED TO DO YOUR OWN RESEARCH AND CONSULT WITH A LICENSED PROFESSIONAL BEFORE MAKING ANY FINANCIAL DECISIONS. THE INFORMATION HEREIN IS CURRENT AS OF THE PUBLICATION DATE AND MAY CHANGE WITHOUT NOTICE.