KEY INSIGHTS
- All-Time High Achieved: Bitcoin has hit $99,336.1, marking another milestone in its bull run.
- Range Formation: A new short-term range between $93,367.7 (support) and $99,336.1 (resistance) has emerged.
- Critical Price Levels: The $85,153 level now serves as a pivotal support, with $73,563.5 as the next major fallback zone should a correction occur.
- RSI Insights: RSI remains in overbought territory. A decline below 70 could indicate a cooling phase, whereas sustained overbought levels could push Bitcoin past $100,000.
Introduction
In last week’s analysis (18 Nov 2024), we witnessed Bitcoin achieving a historic all-time high of $93,367.7, driven by robust institutional support, favorable political developments, and increased investor confidence. At the time, Bitcoin entered a short-term consolidation phase within the $85,056.7 to $93,367.7 range, and our analysis anticipated two key scenarios: either a bullish breakout toward $100,000 or a correction toward key support levels.
This week, Bitcoin has exceeded expectations, breaking through $93,367.7 to set a new all-time high of $99,336.1. The breakout confirms the continuation of the bullish trend and underscores the strength of the current market environment. As we delve into this week’s analysis, we aim to explore the key levels, technical indicators, and market sentiment driving Bitcoin’s remarkable momentum while considering potential outcomes for the weeks ahead.
The question now arises:
Will Bitcoin aim for even higher prices, or is a short-term correction phase imminent? Multiple scenarios are possible, from forming a new trend to trading within a limited range. This analysis aims to address these questions by exploring the significance of the established range, critical price levels, and technical indicators from a multidimensional perspective.
Price Review & Recap of Last Week’s Analysis
In our previous analysis, Bitcoin’s position within the $85,056.7 to $93,367.7 range hinted at short-term consolidation, with RSI (Relative Strength Index) patterns signaling a cooling momentum.
Last week, Bitcoin broke through the $93,367.7 resistance and set a new all-time high of $99,336.1. Amid this rapid rise, the RSI remained around 70, signaling sustained buying pressure within a healthy range.
Initially, we anticipated a range-bound phase with a potential temporary correction. However, Bitcoin decisively broke out of this range and set new highs, providing clear evidence of an ongoing bullish trend.
Now, as Bitcoin reaches this new high of $99,336.1, careful assessment is required to determine whether the cryptocurrency can sustain this bullish momentum or transition into a correction phase. Let’s delve further into the current market environment with detailed technical analysis.
Market Analysis & Price Action
Significant Price Movement Analysis
- All Time High: Bitcoin has hit $99,336.1, maintaining its bullish trend.
- RSI Analysis: The RSI remains in overbought territory, and a drop below 70 could influence the next price move.
- Support Level Concerns: If Bitcoin falls below $85,153, a correction to the next support at $73,563.5 could occur. Conversely, breaking above $100,000 could signal further upside potential.
Range Dynamics
- Current Range Boundaries: Bitcoin is trading within a range of $99,336.1 (resistance) and $93,367.7 (support).
- Hourly Chart Observations: A double-bottom pattern near $95,548.9 suggests potential support, with the 200-day moving average also approaching this level.
- Support and resistance levels are crucial areas of interest for many investors and will be key to determining the future trend.
Detailed Analysis
Daily Chart: Price Trends
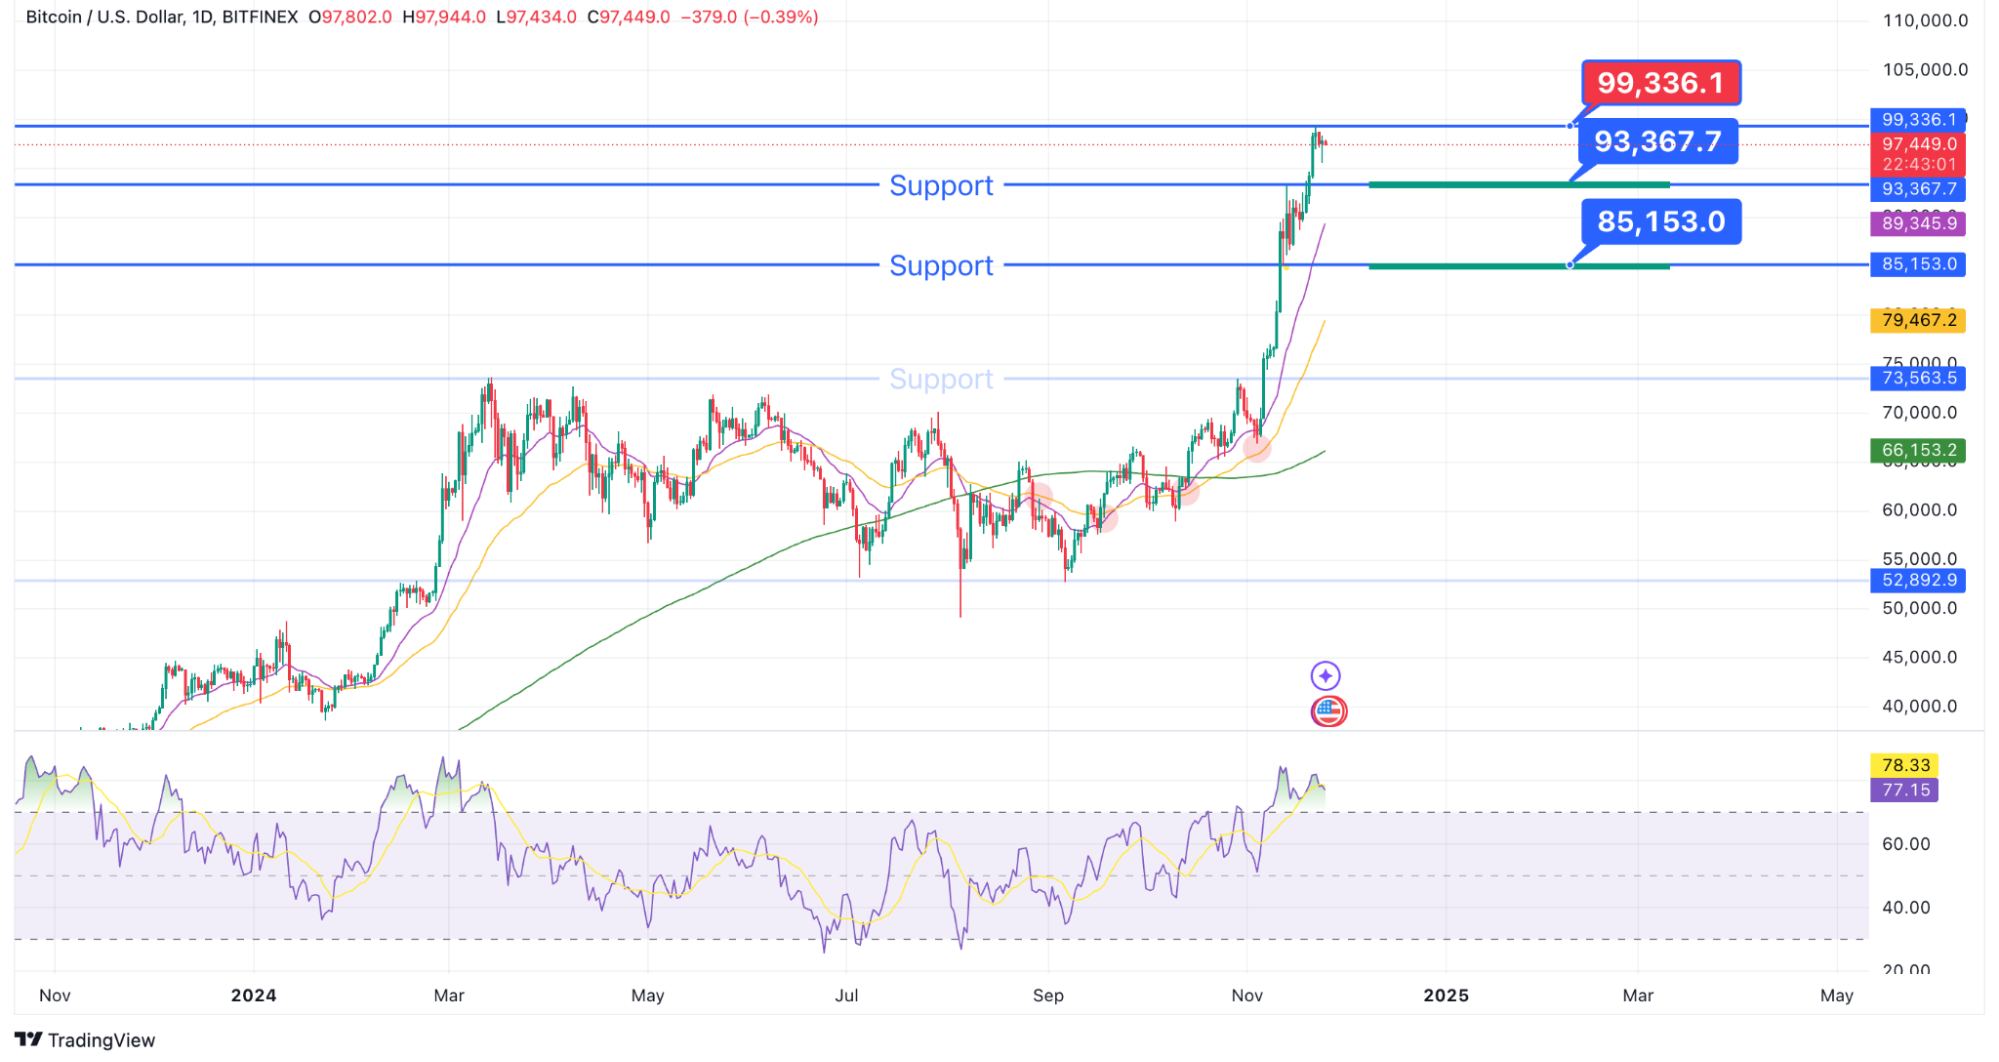
Bitcoin has exhibited remarkable bullish momentum, breaking previous resistance levels and setting new all-time highs. However, the daily chart provides deeper insights into the overall market health and potential future movements:
RSI Trends:
- The RSI remains in overbought territory, which often signals a potential cooling period.
- A drop below 70 could indicate the beginning of a neutral phase, where the price might consolidate or pull back to key support levels before resuming its uptrend.
- If RSI continues to rise above 75-80, it could indicate extreme overbought conditions, which are often followed by corrections.
Key Levels to Watch:
- Resistance: $99,336.1 remains the primary resistance. A break above this level could push Bitcoin into uncharted territory, with psychological levels like $100,000 and beyond becoming the next targets.
- Support Levels: $93,367.7 is the immediate support, while $85,153 and $73,563.5 serve as lower levels to monitor for potential corrections.
- Moving Averages: The 50-day and 200-day moving averages are trending upward, indicating long-term bullish momentum. A price drop to these levels could provide a strong buying opportunity.
4-Hour Chart: Key Levels to Watch
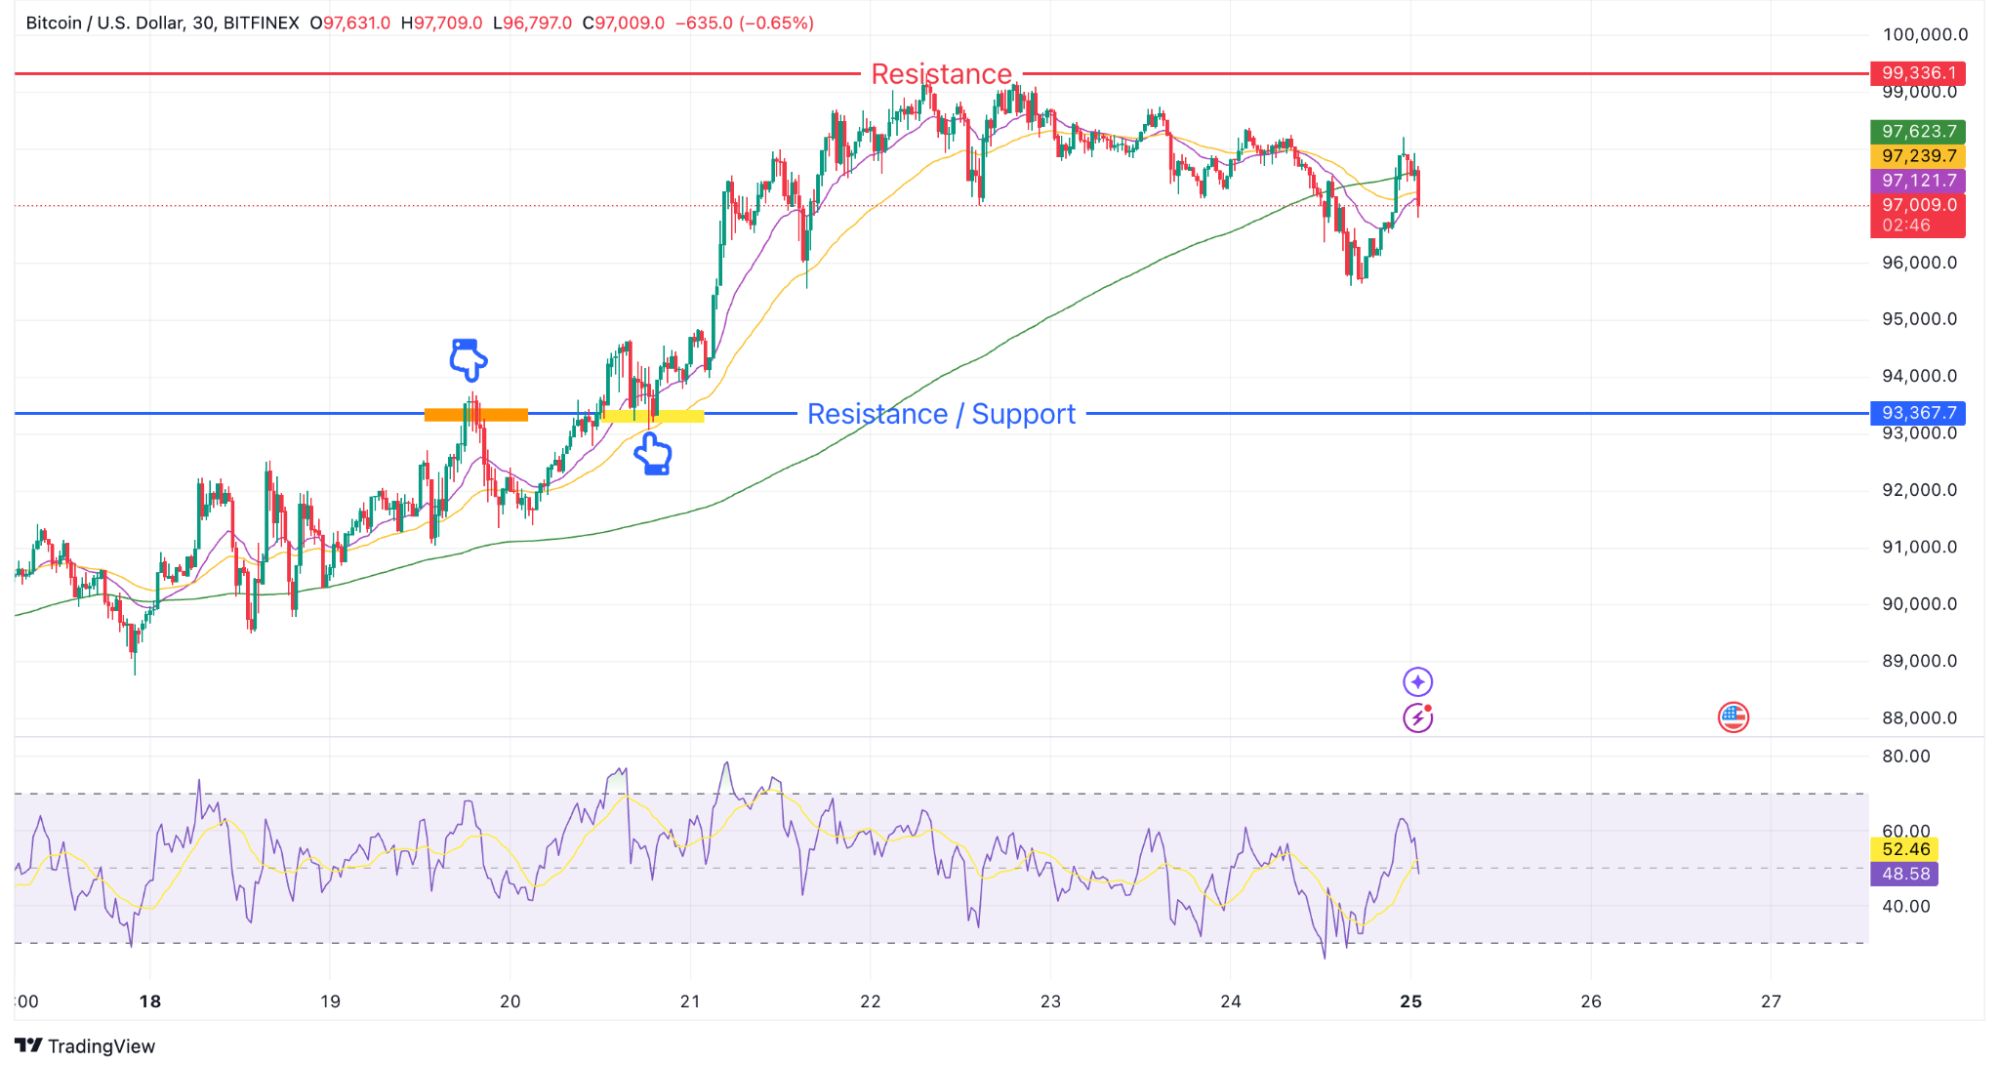
Bitcoin broke the previous range’s upper limit at $93,367.7, rising to $99,336.1 through a role reversal.

New Range Formation: A short-term range with $99,336.1 as resistance and $93,367.7 as support is now evident. How this range resolves will be critical
Bottom Line
The support line at $93,367.7 is a critical level closely monitored by investors. Whether this line continues to hold will be key in determining the short-term trend.
1-Hour Chart: Double-Bottom Support
Double-Bottom Formation at $95,548.9:
- A clear double-bottom pattern has emerged near $95,548.9, suggesting strong buying interest at this level.
- The pattern’s validity depends on a sustained rebound, with confirmation occurring if Bitcoin surpasses $96,800 and approaches $99,000.
Support from Moving Averages:
- The 200-hour moving average is closely aligned with the double-bottom support, reinforcing its importance.
- If Bitcoin fails to hold this level, short-term sentiment may turn bearish, leading to increased selling pressure.
Looking Ahead
The alignment of RSI trends, critical price levels, and moving averages will determine Bitcoin’s trajectory in the weeks to come. Key scenarios include:
- Bullish Continuation: Sustaining above $93,367.7 and breaking $100,000 could signal further upside potential, supported by continued institutional interest.
- Short-Term Correction: A drop below $85,153 may trigger a move toward $73,563.5, testing market confidence and initiating a cooling phase.
By staying updated with weekly analyses, traders can better navigate Bitcoin’s dynamic price movements. Monitoring these critical levels will be essential for anticipating the next phase of this remarkable bull market.
Conclusion
Bitcoin’s price action in the past week has demonstrated remarkable bullish strength, pushing through key resistance levels and reaching an all-time high of $99,336.1. This performance reaffirms the ongoing momentum in the market, fueled by institutional interest, favorable macroeconomic conditions, and increasing confidence in Bitcoin’s potential as a leading asset class. However, while the broader outlook remains optimistic, the market’s near-term direction depends heavily on how it navigates critical support and resistance levels.
Bitcoin’s rally to $99,336.1 underscores the continued strength of its bullish trend. However, the current short-term range and key price levels—$99,336.1, $93,367.7, and $85,153—warrant careful monitoring to assess the sustainability of this momentum.
Bitcoin’s journey to its current highs reflects its growing maturity as an asset and its resilience in the face of market challenges. The coming weeks will be pivotal in determining whether the cryptocurrency continues its ascent toward $100,000 or undergoes a healthy consolidation phase. By leveraging technical analysis and staying attuned to market developments, traders and investors can position themselves effectively to navigate this evolving landscape.
Beginner Friendly Glossary
- Role Reversal
A support and resistance role reversal is when support becomes resistance or vice versa because these levels are broken. When the price breaks through a support or resistance level and then goes back to its original range it’s called a reversal.
Learn more here - RSI (Relative Strength Index)
An indicator derived from the price momentum of any particular asset. The main factors for the computation of the RSI are the asset’s change in price and the speed with which it happens.
Learn more here - Trading Ranges
Ranges in crypto trading refer to the fluctuation of a cryptocurrency’s price within a specific high and low boundary. Understanding and utilizing ranges can help traders identify potential entry and exit points for their trades.
Learn more here - Double Bottom
A double bottom pattern is a classic technical analysis charting formation that represents a major change in trend and a momentum reversal from a prior down move in market trading.
Learn more here - Bullish
The term “Bullish” refers to a positive sentiment for a particular investment or the general market. This refers to a general expectation that the investment or market will grow.
Learn more here
DISCLAIMER: THE CONTENT PROVIDED IN THIS ARTICLE IS FOR INFORMATIONAL PURPOSES ONLY AND SHOULD NOT BE CONSIDERED FINANCIAL, LEGAL, OR INVESTMENT ADVICE. CRYPTOCURRENCY INVESTMENTS CARRY A HIGH DEGREE OF RISK AND MAY NOT BE SUITABLE FOR EVERY INVESTOR. PAST PERFORMANCE DOES NOT GUARANTEE FUTURE RESULTS. THIS ANALYSIS IS INTENDED PURELY AS AN OBSERVATION OF SPECIFIC PRICE LEVELS AND TRENDS TO AID IN UNDERSTANDING POTENTIAL MARKET DIRECTIONS. YOU ARE ENCOURAGED TO DO YOUR OWN RESEARCH AND CONSULT WITH A LICENSED PROFESSIONAL BEFORE MAKING ANY FINANCIAL DECISIONS. THE INFORMATION HEREIN IS CURRENT AS OF THE PUBLICATION DATE AND MAY CHANGE WITHOUT NOTICE.